the Creative Commons Attribution 4.0 License.
the Creative Commons Attribution 4.0 License.
 | 21 Jun 2019
New chronological constraints on the timing of Late Pleistocene glacier advances in northern Switzerland
Dorian Gaar
Hans Rudolf Graf
Frank Preusser
Deposits of the Reuss Glacier in the central northern Alpine foreland of Switzerland are dated using luminescence methodology. Methodological considerations on partial bleaching and fading correction of different signals imply the robustness of the results. An age of ca. 25 ka for sediment directly overlying basal lodgement till corresponds well with existing age constraints for the last maximal position of glaciers of the northern Swiss Alpine Foreland. Luminescence ages imply an earlier advance of Reuss Glacier into the lowlands during Marine Isotope Stage 4. The presented data are compared to findings from other parts of the Alps regarding glacier dynamics and palaeoclimatological implications, such as the source of precipitation during the Late Pleistocene.
Ablagerungen des Reuss-Gletschers im zentralen Teil des nördlichen Alpenvorlandes der Schweiz wurden mit Lumineszenzmethodik datiert. Methodische Überlegungen bezüglich unvollständiger Bleichung und Fadingkorrektur verschiedener Signale bekräftigen die Robustheit der Ergebnisse. Ein Alter von ca. 25 ka für Sedimente oberhalb eines basalen Tills stimmt gut mit der existierenden Chronologie für den letzten Maximalstand der Gletscher im nördlichen Alpenvorland der Schweiz überein. Die Lumineszenzalter weisen zudem auf einen früheren Gletschervorstoß während des marinen Isotopenstadiums 4 hin. Die hier präsentierten Daten werden mit Befunden aus anderen Gebieten der Alpen verglichen, mit Bezug auf Gletscherdynamik und paläoklimatologische Implikationen, wie z.B. die Herkunft von Niederschlägen während des späten Pleistozäns.
- Article
(5552 KB) -
Supplement
(608 KB) - BibTeX
- EndNote


Investigating the extent, geometry and timing of past ice sheets and glacier networks allows for the detection of atmospheric circulation patterns during the Late Pleistocene, as an important contribution for a better understanding of natural climate dynamics (Stokes et al., 2015). For example, Florineth and Schlüchter (2000) as well as Kuhlemann et al. (2008) deduce a more southward position of the polar front over the North Atlantic during the Last Glacial Maximum (LGM) from glacial records. However, it has to be noted that the term LGM is ambiguous: it is either used to refer to the maximum of global cooling during Marine Isotope Stage (MIS) 2 (ca. 29–14 ka ago; Lisiecki and Raymo, 2005) or the last maximum of global ice volume (ca. 22–19 ka on a global scale; Yokoyama et al., 2000), both of which are inferred from deep marine sediment records. Continental records indicate that most ice sheets and glaciers reached their last most extensive position between 26.5 and 19 ka ago, with the onset of deglaciation mainly just after 20 ka (Clark et al., 2009). Interestingly, it appears that in some regions the maximum extent of glaciers after the Last Interglacial was not synchronous with the peak of MIS 2 (cf. Hughes et al., 2013), with important and not yet entirely deciphered indications for past circulation. For example, Jimenez-Sanchez et al. (2013) suggest that the last local glacial maximum in the Pyrenees occurred during MIS 4 and that glaciers during MIS 2 were of substantially smaller extent.
Besides the timing it is also of interest to reconstruct the nature of past glaciations, i.e. the rate of ice advance and the related question of if these were temperate or cold-based glaciers. Answering these questions will be of importance when modelling glaciations (e.g. Haeberli and Schlüchter, 1987; Becker et al., 2016; Seguinot et al., 2018) and their potential to deeply erode into bedrock (e.g. Headly and Ehlers, 2015). Beside pure scientific interests, the question of possibly future glacial erosion is of high interest for the siting of nuclear waste disposal sites (Haeberli, 2010; McEvoy et al., 2016).
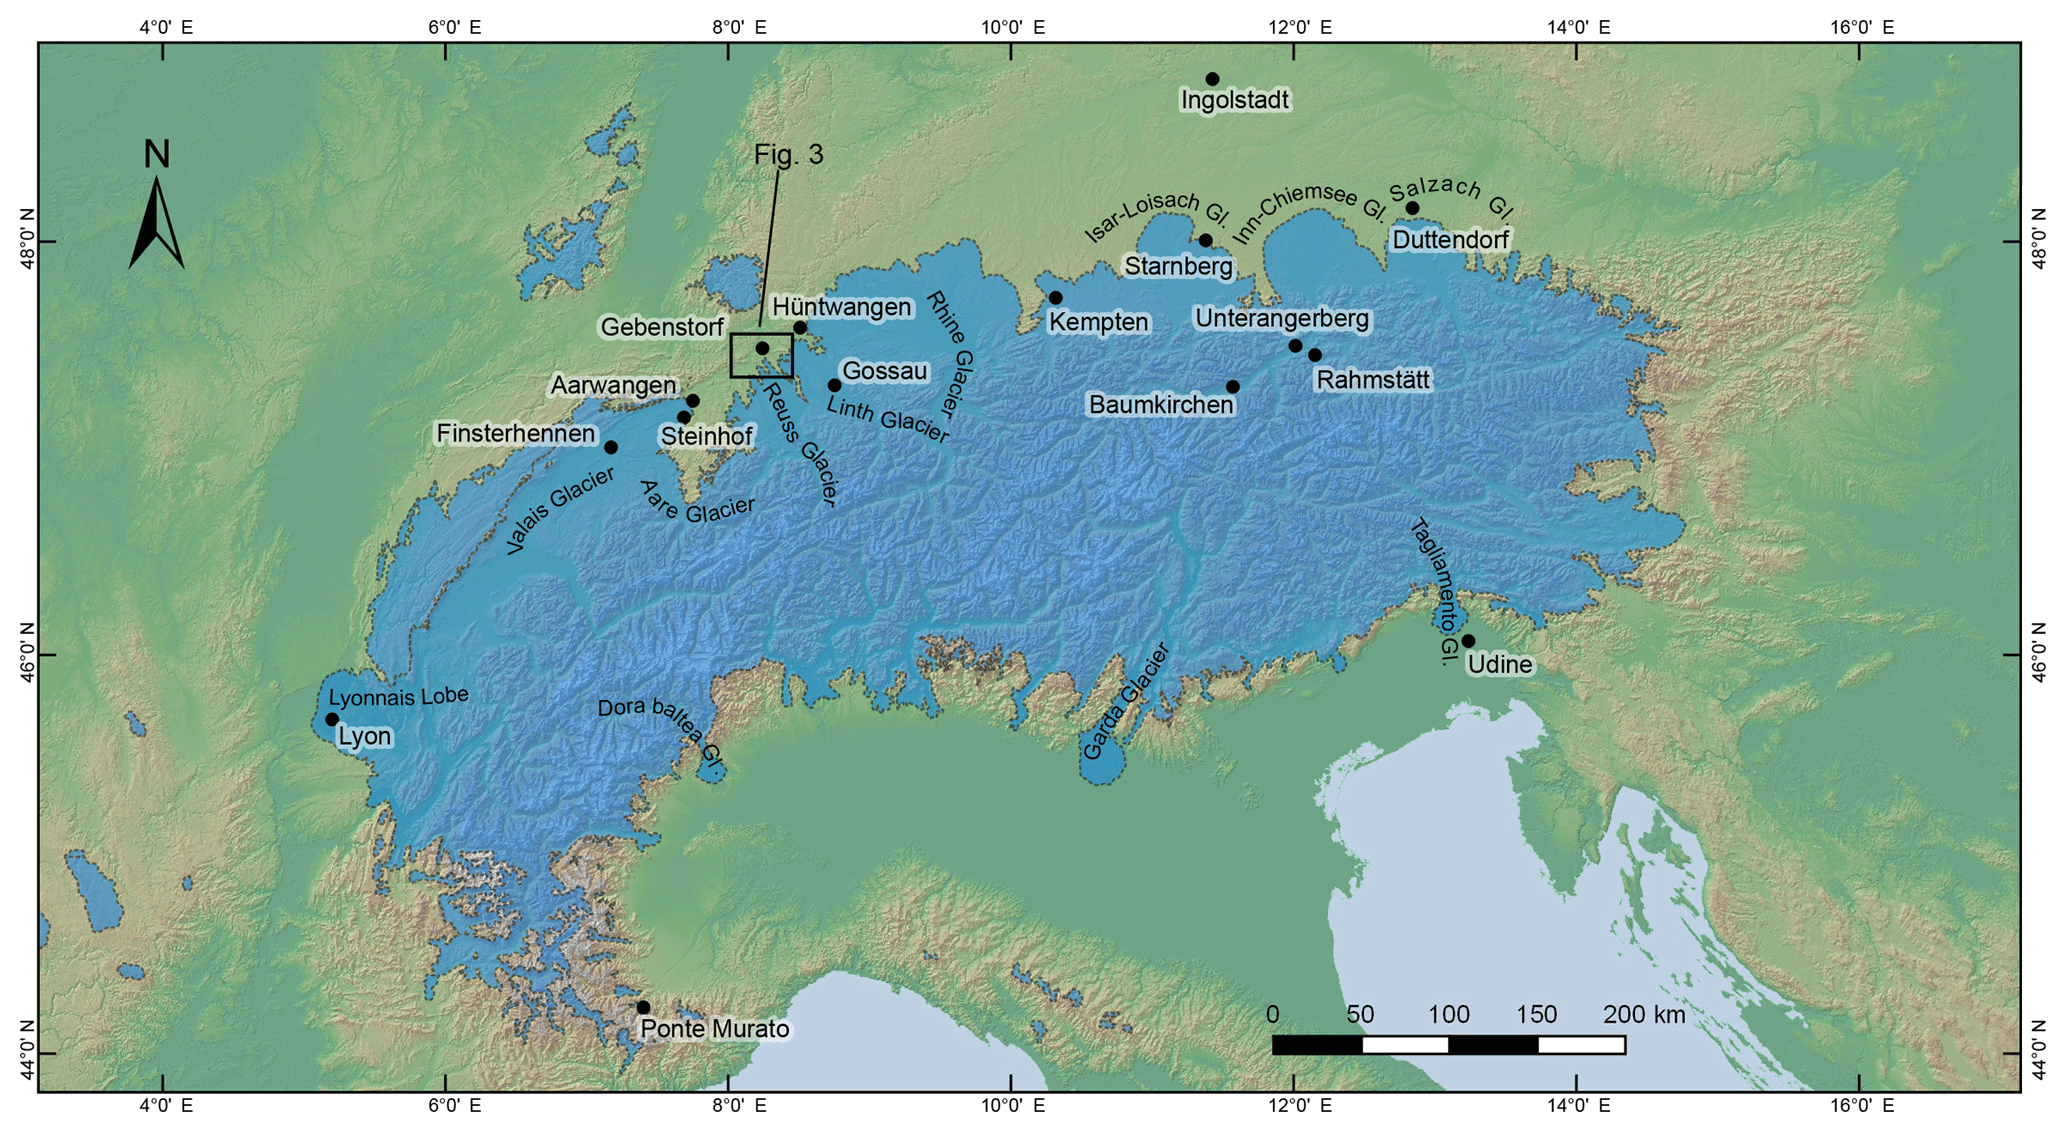
Figure 1Overview of the Alps with the ice extent ca. 24 ka ago according to Ehlers and Gibbard (2004) with sites mentioned in the text. Elevation data from Jarvis et al. (2008). References for the sites are as follows: Lyon – Mandier et al. (2003); Ponte Murato – Federici et al. (2012); Udine – Monegato et al. (2007); Duttendorf – Starnberger et al. (2011); Baumkirchen – Klasen et al. (2007) and Spötl et al. (2013); Starnberg – Reuther et al. (2011); Steinhof – Ivy-Ochs et al. (2004); Ingolstadt – Fiebig and Preusser (2003); Gossau – Preusser et al. (2003); Kempten – Link and Preusser (2005); Hüntwangen, Aarwangen, and Finsterhennen – Preusser et al. (2007); Unterangerberg – Starnberger et al. (2013); Rahmstätt – Klasen et al. (2007).
For the Alps, the timing of the last maximum extent of glaciers (Fig. 1) at first appears fairly well constrained (e.g. Ivy-Ochs et al., 2008). However, direct dating is actually limited to a few sites and the available data do, when analysed closely, reveal several discrepancies with regard to the exact timing. For the Lyonnais lobe of the French Alps (Fig. 1), the largest extension of glaciers since the Last Interglacial appears to be older than 40 ka, with a less extensive, polyphase terminal moraine radiocarbon dated to around 23 and 19 ka (Mandier, 2003; Mandier et al., 2003). In the SW Italian Alps, at Ponte Murato (Fig. 1), 10Be dated boulders on terminal moraines have a mean age of 20±2 ka (Federici et al., 2012), apparently in concert with the global isotopic signal. According to Ravazzi et al. (2014), glacier collapse in the Lake Garda area (Fig. 1) occurred soon after 17.5±0.2 ka cal BP. For the Tagliamento end-moraine system (Fig. 1), a two-fold glacial advance is recorded with the larger extent between 26.5 and 23 ka and the second, slightly smaller extent to 24–21 ka by radiocarbon dating (Monegato et al., 2007). A similar pattern is found in the former Salzach Glacier of the NE Alps, at Duttendorf (Fig. 1), with continuous loess accumulation dated to ca. 30 to 21 ka by luminescence dating (Starnberger et al., 2011). The inner Alpine position of Baumkirchen (Fig. 1) was reached by ice 33–32 ka ago according to both radiocarbon (Spötl et al., 2013) and luminescence dating (Klasen et al., 2007). 10Be exposure dating of terminal moraines of the type locality of the Würmian glaciation at Starnberg (Fig. 1) gives only a minimum age ca. 18 ka due to post-depositional instability of the dated boulders (Reuther et al., 2011). Luminescence dating of glaciofluvial sediments of the last Würmian ice advance in the Würm Valley reveals ages of ca. 29 ka, constraining the maximum age for this ice advance (Klasen et al., 2007). An early phase of ice decay inside the Alps is recorded by kame deposits at Rahmstätt (Fig. 1), with a mean luminescence age of ca. 19 ka (Klasen et al., 2007).
For the NW Alps, Keller and Krayss (2005a, b) established a model of the last advance and decay of the Rhine Glacier lobe into the foreland (Fig. 1) based on previously published radiocarbon data. However, this study lacks information on the dating uncertainties and is not up to date with regard to calibration. For the present study, the uncalibrated 14C data were collected from the original sources and calibrated using OxCal 4.2 (Bronk Ramsey, 2009), applying the IntCal13 calibration curve (Reimer et al., 2013; Table 1). According to these data (Fig. 2), ice build-up of the LGM Rhine Glacier started around 29 ka and reached its maximum between 26 and 22 ka ago, with the decaying ice front reaching the inner Alpine valleys before 17 ka. The radiocarbon chronology is confirmed by quartz luminescence ages for an outcrop at Hüntwangen (Fig. 1), ca. 4 km downstream of the maximum terminal moraine of the last glacier advance (Preusser et al., 2007). Outwash gravel in an ice proximal position has an age of 25.0±2.0 ka and overbank deposits attributed to a melting phase date between 22.2±1.6 and 17.1±1.3 ka.
Table 1Radiocarbon ages used for the ice build-up and decay model of the Rhine glacier, only showing samples for which the original radiocarbon ages are available and that therefore allow calibration.

a No measurement uncertainty indicated in original publication.
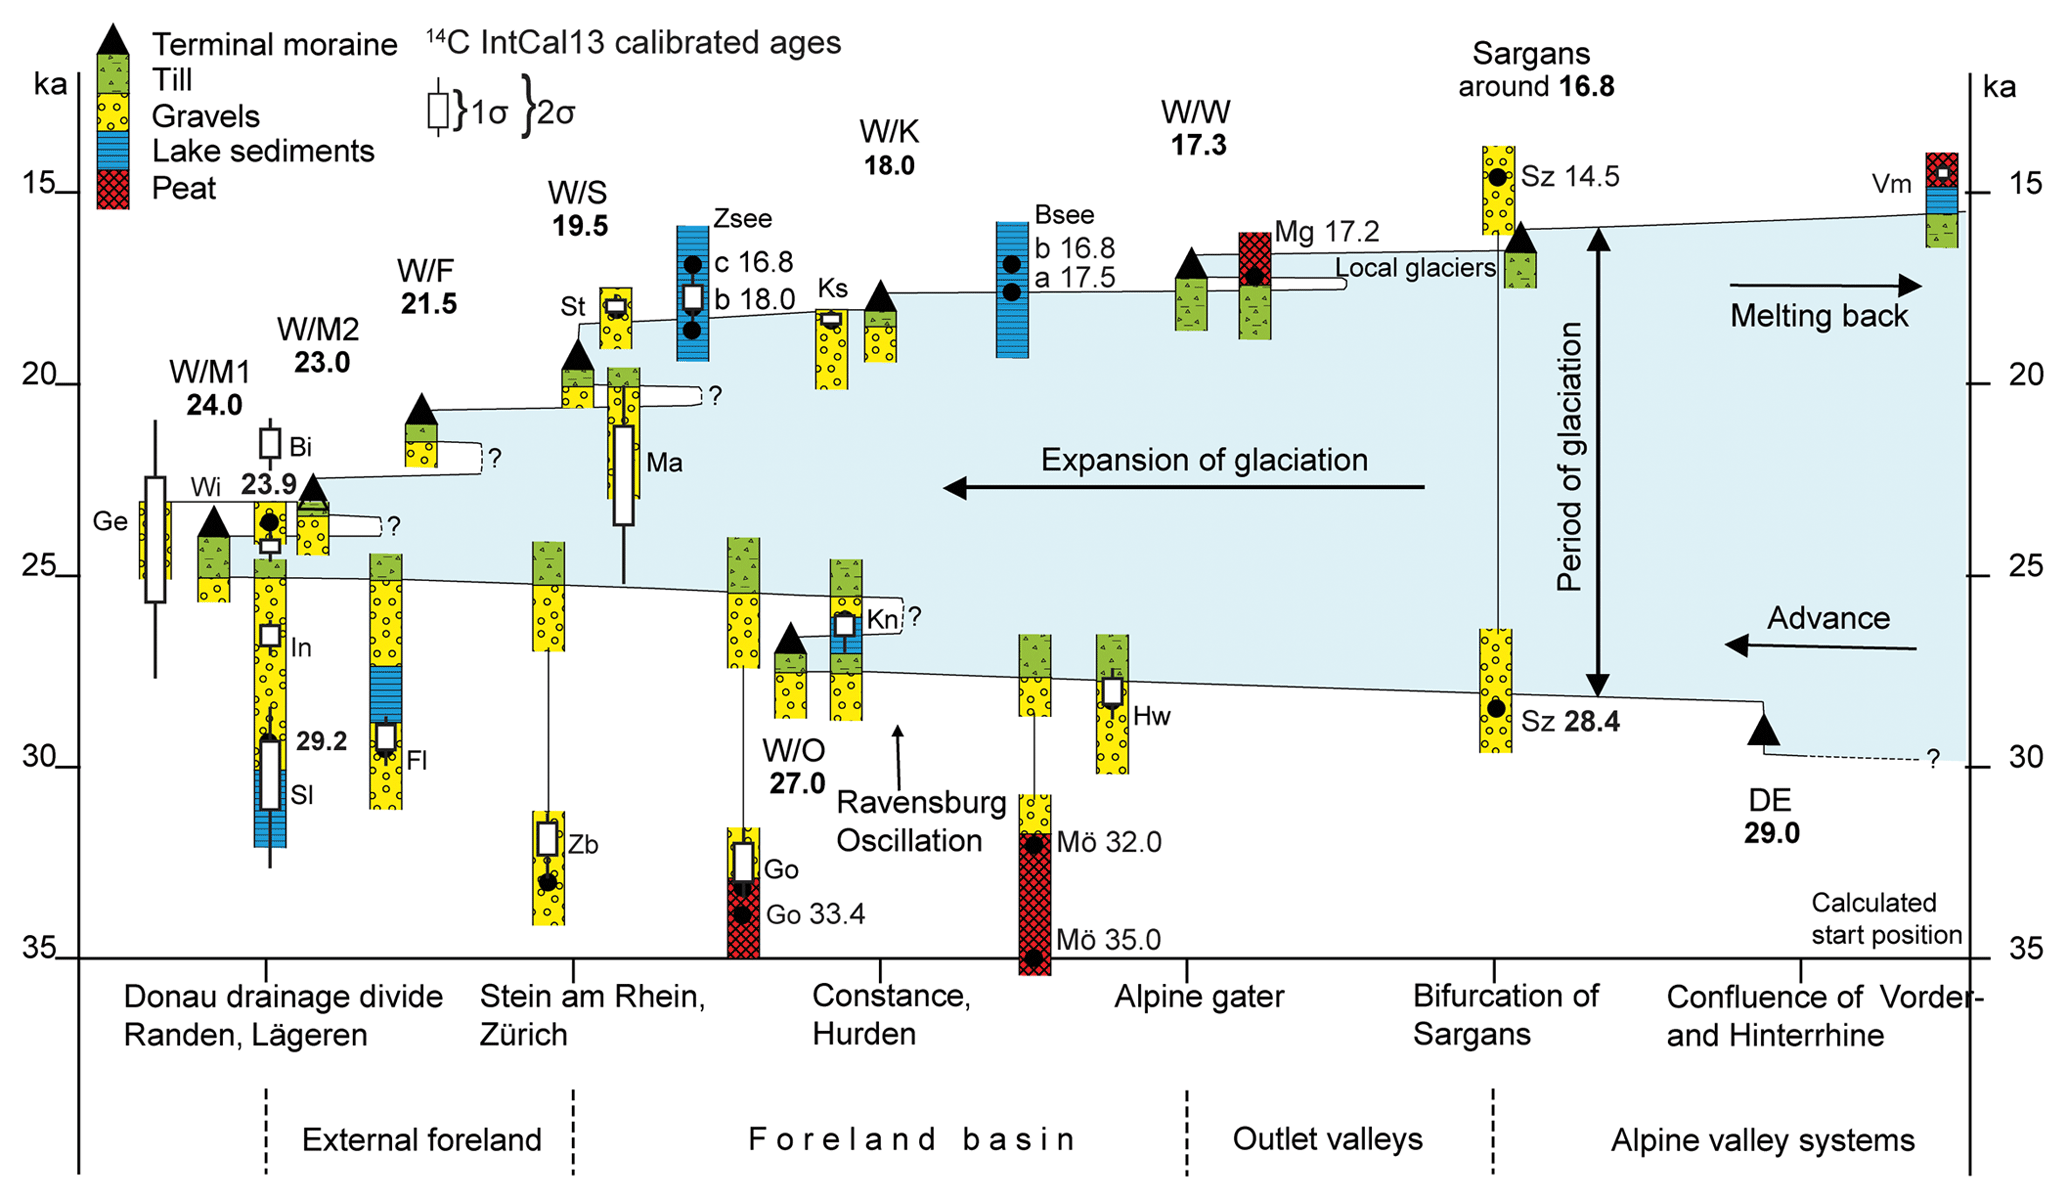
Figure 2Chronology of the last glacial advance of the Rhine–Linth Glacier (Birrfeld/Würm) complemented with recalibrated radiocarbon ages (white boxes) using IntCal13; figure taken from Preusser et al. (2011) and redrawn after Keller and Krayss (2005a, b). Ice marginal positions: DE – Domat/Ems, W/O – Obersee, W/M1 – outer maximum, W/M2 – inner maximum, W/F – Feuerthalen, W/S – Stein am Rhein, W/K – Konstanz, W/W – Weissbad.
For the Reuss Glacier lobe (Fig. 1), several radiocarbon ages of large mammal finds from glaciofluvial gravels constrain the last ice advance (Graf, 2009). Their calibrated (IntCal13) ages range between 26.9 and 21.6 ka BP but their position with regard to glacier advance or retreat is not known precisely. Glaciofluvial gravel from Gebenstorf (Fig. 3 GE) has luminescence ages of 32.9±4.6 and 26.1±3.4 ka (Gaar et al., 2014). According to 10Be and 36Cl dating, the minimum age of ice decay is 22.2±1.0 ka at the frontal position and 20.4±1.0 ka at the lateral position. By latest 18.6±0.9 ka Reuss Glacier was approximately 12 km behind the maximal extent position (Reber et al., 2014). Gravel aggradation of the Low Terrace in the Hochrhein Valley dates to ca. 30 to 15 ka (quartz luminescence) and a second phase between 13 and 11 ka (Kock et al., 2009a, b).
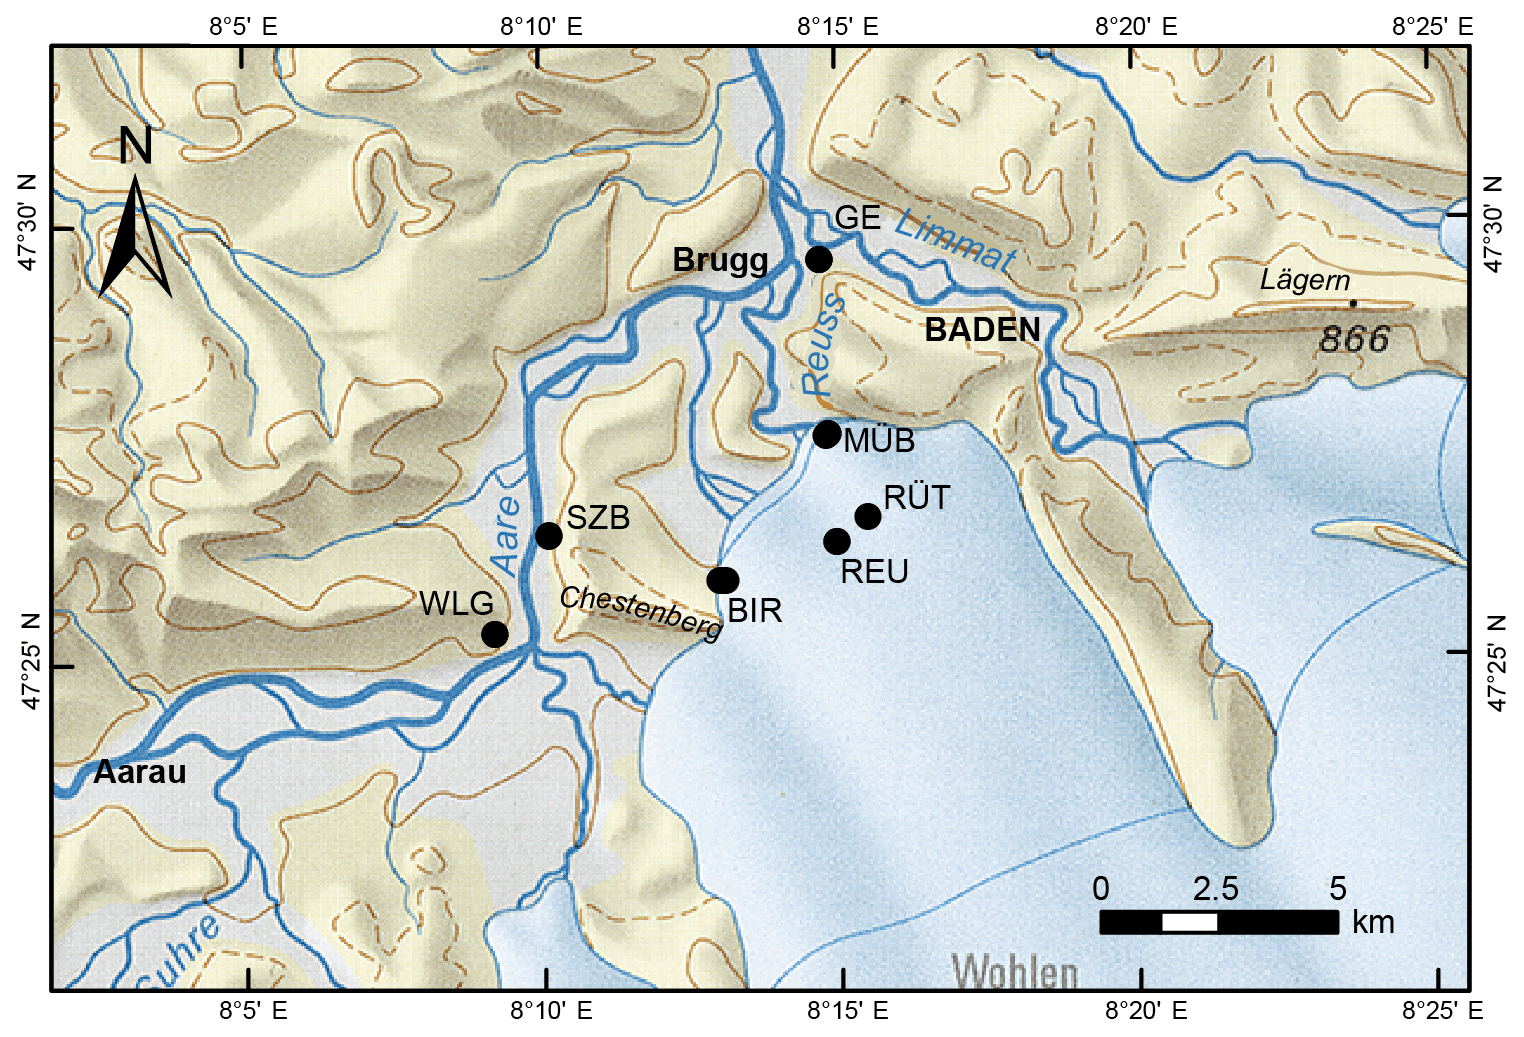
Figure 3Map of the Birrfeld area during the LGM with sampling sites of this study and samples of earlier studies (WLG: Gaar and Preusser, 2012, and GE: Gaar et al., 2014). Background map by Bini et al. (2009). Source: Swiss Federal Office of Topography.
For the Swiss lobe of the Valais Glacier, the terminal moraine near Steinhof (Fig. 1) was dated by 10Be, 26Al and 36Cl (Ivy-Ochs et al., 2004). The original data are recalculated here by applying the NE North America production rate (Balco et al., 2009), no snow correction and an erosion rate to 1 mm ka−1, using the CRONUS Earth calculator 2.2 (Balco et al., 2008). This yields an age of 24.1±1.9 ka for the maximum terminal position and 22.8±1.8 ka for the onset of deglaciation. In the same region (Aarwangen gravel pit, Fig. 1), luminescence dating suffers from partial bleaching and the resulting ages of 27.4±2.8 and 25.7±4.2 ka are interpreted as maximum estimates for the ice advance (Preusser et al., 2007). At Finsterhennen (Fig. 1), radiocarbon (mammoth tusk) and quartz luminescence ages for the basal part of LGM glaciofluvial accumulation are between 30 and 25 ka (Preusser et al., 2007).
Already Köppen and Wegener (1924) discuss an extensive glaciation during the Würmian prior to the LGM, based on the astronomical parameters calculated by Milanković (1941). The same authors later referred to these expected glacier advances as Würm I (ca. 115 ka) and Würm II (ca. 70 ka) (Köppen and Wegener, 1940). This concept was originally entirely based on theoretical considerations and not supported by evidence from the geological record. Based on pollen records and correlations with marine isotope stratigraphy, Welten (1981) designates an early Würmian cold stage and supposes a substantial glacial advance (called Turicum 1a) shortly after the Last Interglacial, followed by mild climatic conditions and another glacial advance between 70 and 55 ka. Schlüchter (1986) discusses the possibility that the MIS 4 glacier extent is larger than MIS 2, and Frenzel (1991) postulates a large advance of the Rhine Glacier shortly after the Eemian Interglacial based on pollen records. Keller and Krayss (1998) compile lithostratigraphic indications for a Middle Würmian glacier advance and reconstruct its dimensions, tentatively placed into MIS 4. Luminescence dating of (glacio?)-fluvial sediments in the area of Ingolstadt (Fig. 1) indicates that parts of the deposits, originally interpreted as the distal part of outwash plains of the penultimate glacial cycle (Rissian), might actually be younger than the Last Interglacial (Fiebig and Preusser, 2003). Link and Preusser (2005) describe evidence for a possible MIS 4 glaciation in SW Germany (Kempten, Fig. 1), based on luminescence dating of proglacial lake deposits. Preusser et al. (2003) luminescence dated sediments at the gravel pit of Gossau (Fig. 1), which were interpreted as MIS 4 (glacial) delta sediments. However, the dating results rather point towards a deposition during MIS 5d, i.e. the Turicum 1a of Welten (1981). Gravel attributed to an advancing glacier in the Reuss Valley close to Mülligen (Fig. 3) has a mean luminescence age of 66±9 ka (Preusser and Graf, 2002). Probably the most compelling evidence for the Valais Glacier, reaching the lowlands of Switzerland during MIS 4, is given by Preusser et al. (2007). In the Finsterhennen gravel pit (Fig. 1), the age of a lower till is older than 30 ka according to radiocarbon and luminescence dating. Glaciofluvial deposits from just below the till have a quartz luminescence age of ca. 70 ka.
In this article, we present a new set of luminescence ages further constraining the timing of glacial advances in the Reuss Glacier system, situated in between the areas occupied by the main lobes of the Rhine Glacier and Valais Glacier during the Late Pleistocene (Figs. 1, 3). For this area, a revised system of Quaternary glaciations was developed by Graf (2009; summarised in Preusser et al., 2011), as the scheme by Penck and Brückner (1901–1909) does not fully reflect the complex pattern observed in sediment sequences of northern Switzerland. The type location of the last glacial advance (Würm sensu stricto), the Birrfeld Glacial of Graf (2009), is investigated in this article. Furthermore, recent developments in luminescence methodology led us to redate the Mülligen outcrop previously investigated by Preusser and Graf (2002). Besides the implications for the chronology of Late Pleistocene glacier advances in northern Switzerland, and in comparison to other parts of the Alps, a detailed discussion of methodological aspects is provided. This aims to, firstly, corroborate the reliability of the presented results and, secondly, add connotations to the performance of different luminescence techniques for the dating of proglacial sediments in general.
2.1 Regional setting
Birrfeld, i.e. the mainly flat area between the rivers Aare and Reuss (with the village of Birr), is situated between the two most easterly surface fold structures of the Jura Mountains. The oldest Quaternary sediments of the region are scarce occurrences of Early Pleistocene gravel sheet (Deckenschotter) deposits (Graf, 1993). As the result of subglacial erosion, overdeepened valleys formed during the Middle Pleistocene (cf. Preusser et al., 2010), which often contain complex sequences of multiphase sediment successions (e.g. Graf, 2009; Dehnert et al., 2012). At the base, the valley fillings comprise coarse-grained subglacial gravel and till intercalating with or overlain by water-lain till or thick post-glacial lacustrine sediments. The geometrical and chronological relationship between the different types of deposit is yet poorly understood due to the limited data available, as the sedimentary records are only accessible via coring and have seen a limited application of modern sedimentological approaches and dating methods (e.g. luminescence). However, there appears to be evidence for four superimposed glacial successions in the area, at least two of which are older than the Last Interglacial, as indicated by palaeosols (Graf, 2009; Preusser et al., 2011). Exposed in outcrops are mainly deposits of the younger glaciations that are the focus of the present study.
2.2 Gravel pit Joriacher (BIR)
The gravel pit Joriacher (47∘25′50′′ N, 8∘12′59′′ E), near the village Birr, is located at the SW end of Birrfeld (Fig. 3). The basal unit is composed of sandy, mainly coarse and partly open-worked gravel intercalated by cobbles and blocks (Fig. 4). The petrographic composition represents an alpine spectrum with crystalline components (e.g. granodiorites), strongly weathered into loose aggregates of detritus. Due to its rather coarse components and petrographic composition the gravel is interpreted to be of glaciofluvial origin. The gravel is topped by a yellow-brownish decalcified silty gravel of about 2 m thickness, interpreted as fBt horizon (Graf, 2009; Fig. 4). Locally, black precipitation occurs and deeper parts of this palaeosol reach about 1 m into the underlying unweathered gravel in a cone-shaped pattern. A clayey–silty fine sediment of about 1 m thickness is found above the palaeosol without a change of colour. Whether this continuity in colour indicates a deposition of the fine sediment synchronous with soil formation or whether there is a hiatus remains unclear. The fine-sediment layer is interpreted as low-energy fluvial (overbank?) deposits and sample BIR-1 was taken from it. Another coarse-grained gravel intercalated by blocks (up to >1.5 m in diameter) and sand layers tops the brown palaeosol with a sharp contact. It has the same petrographic composition as the lower gravel unit but without indication of weathering. Sample BIR-2 was taken from a 40 cm thick, massive sand layer found within this gravel. Other sand layers in this gravel show cross-bedding structures. The succession of gravel is interrupted by a ca. 80 cm thick diamicton with angular components, interpreted as a basal lodgement till, directly indicating a past glacier presence at this position. The top of this diamicton bears locally fine silty-clayey sediment of ca. 40 cm thickness. This fine sediment likely represents the infill of a pond in front of a retreating glacier. The age of sample BIR-3 from this fine-grained sediment will mark the retreat of ice from its maximum position in this part of Birrfeld, as no other till is found above.

Figure 4Schematic logs of the sections at the gravel pit Joriacher in Birr (BIR), outcrop by the bridge over river Reuss close to Mülligen (MÜB) and outcrop close to Schinznach-Bad (SZB).
2.3 Low Terrace in the Aare Valley (SZB)
In the valley of the River Aare, just to the west of Birrfeld, a succession of gravel builds up the Low Terrace, which is attributed to the last glacial advance. At Schinznach-Bad (47∘26′22′′ N, 8∘10′4′′ E; Fig. 3 SZB) it is composed of silty, sandy gravel with cobbles and scarce boulders (<50 cm) directly overlying the bedrock (Fig. 4). Two samples were taken, one (SZB-1) from a 30 cm thick sand layer at the base of the gravel, 80 cm above the bedrock, and one (SZB-2) from a 20 cm thick sand layer about 2 m above the bedrock. To account for the possible inhomogeneity in the radiation field in this thin sand layer, a second sample from the surrounding sandy gravel was taken 10 cm below the sand layer for determination of dose-rate-relevant elements.
2.4 Outcrop Mülligen (MÜB)
This outcrop is located close to the bridge between the villages of Mülligen and Birmenstorf, on the left-hand side of River Reuss (47∘27′29′′ N, 8∘14′46′′ E; Fig. 3). The outcrop shows a coarsening upwards succession of medium-sized sand towards gravel (Fig. 4). The sequence is interpreted to be of fluvial origin with a decreasing transport distance; thus it most likely represents an advancing glacier. Considering the rather fine sediment and good sorting, the sediment source has to be assumed a few kilometres upstream for the sampled sandy units (MÜB-5 and 6). About 4 m below the present surface, a brown layer is interpreted as the remains of a palaeosol (Preusser and Graf, 2002) and sample MÜB-7 has been taken from a sandy layer just above. In a neighbouring gravel pit (Niderhard, Birmenstorf), the molar of a mammoth found at a similar depth to the palaeosol was dated to ca. 36 ka cal BP (ETH-17251, Graf, 2009).
2.5 Reuss Valley (RÜT and REU)
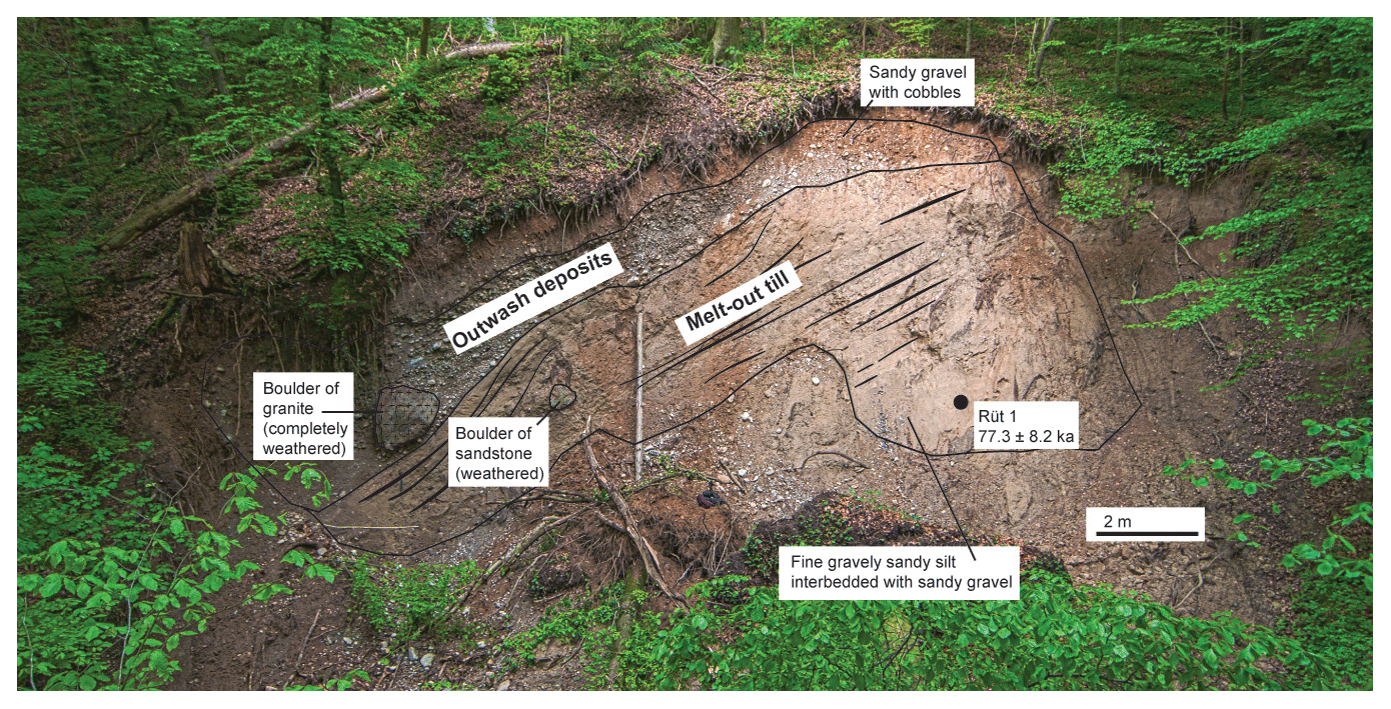
Sample RÜT-1 was taken from a natural outcrop situated in a small valley (Fig. 5), west of the sewage plant of Rütihof (47∘26′33′′ N, 8∘15′26′′ E; Fig. 3). The lower part of the outcrop is classified as diamicton, consisting of clayey, sandy silt interbedded with clayey silty sand (alternating in the decimetre range), both containing calcite. Coarse-gravel layers occur as a frequent accessory in both types of deposit. The pebbles are subangular to subrounded and partly show weak striations; large boulders (>1 m) are scarce. The lithology of the components reflects both alpine and local origin. Bedding is inclined by 25–30∘ towards 280∘ west, steepening in the westernmost part. Based on these observations, the sediment is interpreted as melt-out till (Graf, 2009) and sample RÜT-1 was taken from a sandy bed. The diamicton is topped by sandy coarse gravel with subrounded cobbles, interpreted as outwash deposited in proximity to a glacier.
The two samples REU-1 and REU-2 were taken on the left-hand side of the River Reuss, close to the village of Birrhard (47∘26′15′′ N, 8∘14′53′′ E, Fig. 3). The sampled unit is mica-rich and composed of clayey to silty fine sand, which is horizontally bedded with wave or climbing ripples. Calcitic concretions are abundant in parallel strata, which are tilted locally. Graf (2009) interprets this sand as deposit of a shallow lake with strong currents. Accordingly, occasional desiccation led to the calcitic concretions and cementation. The tilting of the concretions is interpreted to be caused by later glaciotectonical processes. The total thickness of this sand is probably exceeding 20 m (borehole data). This outcrop is interpreted to represent the basal and more distal part of the coarsening upward sequence already sampled at Müllingen (MÜB-5 and 6).
3.1 Sampling and sample preparation
Most samples were taken from homogeneous layers of several decimetres thickness composed of either sand or silt. Sampling faces were cleaned by removing some decimetres of sediment. A metal cylinder, closed at one end, was forced into the sediment immediately, minimising exposition to daylight. The cylinders were then emptied into opaque plastic bags by avoiding daylight exposition.
All sample preparation was performed in the laboratory under subdued red-light (peak emission at 660 nm) conditions. Samples were chemically cleaned with HCl (32 %) and H2O2 (30 %) to remove carbonates and organic material. From the fine-grain samples, the 4–11 µm fraction was obtained by applying the settling technique using Stokes' law. A part of the polymineral fraction was subsequently etched for 10 days in H2SiF6 (34 %) to remove feldspars and HCl (32 %) was used to dissolve fluorite precipitates that formed during etching. The coarse-grain samples were separated for their 200–250 µm fraction by dry sieving. The chemical cleaning with HCl and H2O2 was followed by density separation using an aqueous sodium polytungstate solution at two densities (ρ=2.70 and 2.58 g cm−3) to remove heavy minerals and to obtain a quartz-rich and a K-feldspar-rich fraction. The quartz fraction was etched for 60 min in HF (40 %) to remove remaining feldspar and the outer rim of the quartz grains, followed by HCl treatment to dissolve fluoride precipitates formed during the HF treatment. Final sieving of the etched quartz was carried out to remove feldspar grains that will have substantially reduced in size during etching.
Table 2Results of high-resolution gamma spectrometry and resulting dose rates during burial. (Weff is effective water content relative to dry mass, Q is quartz and F is feldspar).

a U disequilibrium detected and time-dependent depletion modelled. b Possible inhomogeneous radiation field modelled using a second sample from surrounding sediment.
3.2 Dose rate determination
The concentrations of dose-rate-relevant elements (U, K, Th) were determined using high-resolution gamma spectrometry (Preusser and Kasper, 2001) on bulk sediment samples of ca. 450 g; results are shown in Table 2. Indications of radioactive disequilibria in the uranium decay chain have been observed for samples RÜT-1 and SZB-1 when comparing the activity of 238U and 226Ra (Preusser and Degering, 2007). For these two samples a polyphase U depletion model was applied using ADELE software (Kulig, 2005) to account for the loss of U over time. In this model, we assume a depletion of water soluble U since the beginning of the Holocene, when climate is known to be changing towards warmer conditions and hence water is mobilised. The difference in effective dose rate between a conservative approach with no U depletion and modelled dose rates is minor for the feldspar fractions of SZB-1 (less than 0.3 %) and moderate for RÜT-1 (5.7 %). For the coarse-grain quartz fraction, the difference is negligible because the influence of U on the total dose rate is low, as the rim affected by the alpha radiation is removed during HF etching. Sample SZB-2 has been taken from a thin sand layer and an influence on the radiation field of the sample from the surrounding sediment has to be assumed. A second sample taken 10 cm below the sampled sand layer allowed the calculation of the effective radiation field using a model with several layers of different content of dose-rate-relevant elements (using ADELE software).
The cosmogenic dose rate was assessed by ADELE software, following Prescott and Hutton (1994) for cosmic dose estimation, using modern burial depth and a density of 2 g cm−3. The calculated contribution from cosmic radiation is taken into account with a relative uncertainty of 10 %.
Potassium content of feldspar and polymineral samples was assumed to be 12.5±1.0 % following the estimates of Huntley and Baril (1997) and our own measurements (Gaar et al., 2014). This was cross-checked for one sample (RÜT-1) by analysing randomly selected grains of the feldspar separate by electron microprobe analysis (see Gaar et al., 2014, for technical details). Of the 200 grains, 35 grains were identified as quartz; the rest was identified as feldspar. Backscattered electron microscopy imagery reveals scarce perthitic grains, but the vast majority of grains are homogeneous. While 16 grains have an albite (Na-feldspar) or intermediate composition, the large majority of 167 grains are orthoclase (K-feldspar). The average K content of the measured feldspars is 12.77±0.25 % (standard error). The mean measured for the orthoclase only is 13.57±0.09 %.
The efficiency of alpha particles in causing radiation damage (alpha efficiency, a-value) is assumed based on literature values. For coarse feldspar and polymineral fine grains an a-value of 0.05±0.01 was used following Preusser (1999) and Preusser et al. (2001), representing the geographically closest a-value assessments. For fine-grain quartz an a-value of 0.03±0.01 was used (Mauz et al., 2006). Since the outer rim is removed by HF etching for coarse-grain quartz, the a-value is not considered for palaeodose estimates on this fraction. Modern sediment water content was assessed by drying the sample the laboratory at 50 ∘C until a constant mass was reached. In order to account for varying water contents, large uncertainty was given to the assessed water content values.
3.3 Equipment and equivalent dose determination
Luminescence measurements were made on automated Risø TL/OSL DA-20 readers equipped with 9235QA photomultiplier tubes. For single-grain measurements a Risø single-grain laser attachment with dual lasers was used (Bøtter-Jensen et al., 2003). The β source of the reader has been checked for inhomogeneity using a β radiation sensitive self-developing film (Lapp et al., 2012). As non-uniformity of the β source is minor, no correction on the single-grains measurements was applied. Optically stimulated luminescence (OSL) from quartz multigrain aliquots was stimulated with blue LEDs and single grains with a green laser. Signal detection was in the near-UV emission spectrum (Hoya U-340 filter). Infrared stimulated luminescence (IRSL) from feldspars was stimulated in the near infrared (LEDs for multigrain aliquots, laser for single grains) and signal detection was in the blue emission band (Schott BG-39 with 410 nm interference filter). Palaeodoses were determined using modified single-aliquot regenerative-dose (SAR) protocols after Murray and Wintle (2000), Blair et al. (2005) and Thomsen et al. (2008) (Table 3). Preheat temperatures were checked using dose recovery tests (discussed below) and an appropriate preheat temperature was chosen where dose recovery ratios are within 10 % of unity and sensitivity change during the SAR protocol is low. Preheating to 230 ∘C for 10 s after all irradiation steps was chosen for both quartz and feldspar. Equivalent doses (De) were calculated using Luminescence Analyst 4.11 (Duller, 2013). While the majority of aliquots have sufficiently bright OSL signals, in some the OSL intensity is too low to allow for proper analyses (Fig. 6). In the bright aliquots, quartz signals are dominated by the fast component, as shown exemplarily in Fig. 7. For quartz multigrain aliquots (single grains) the first 0.4 s (0.04 s) of the signal, minus the signal 40–60 s (2–5 s) as background, was used for calculations. For feldspar multigrain aliquots (single grains) using the IR50 protocol, the first 10 s (1 s) were used, minus the final 50 s (2 s) as background.
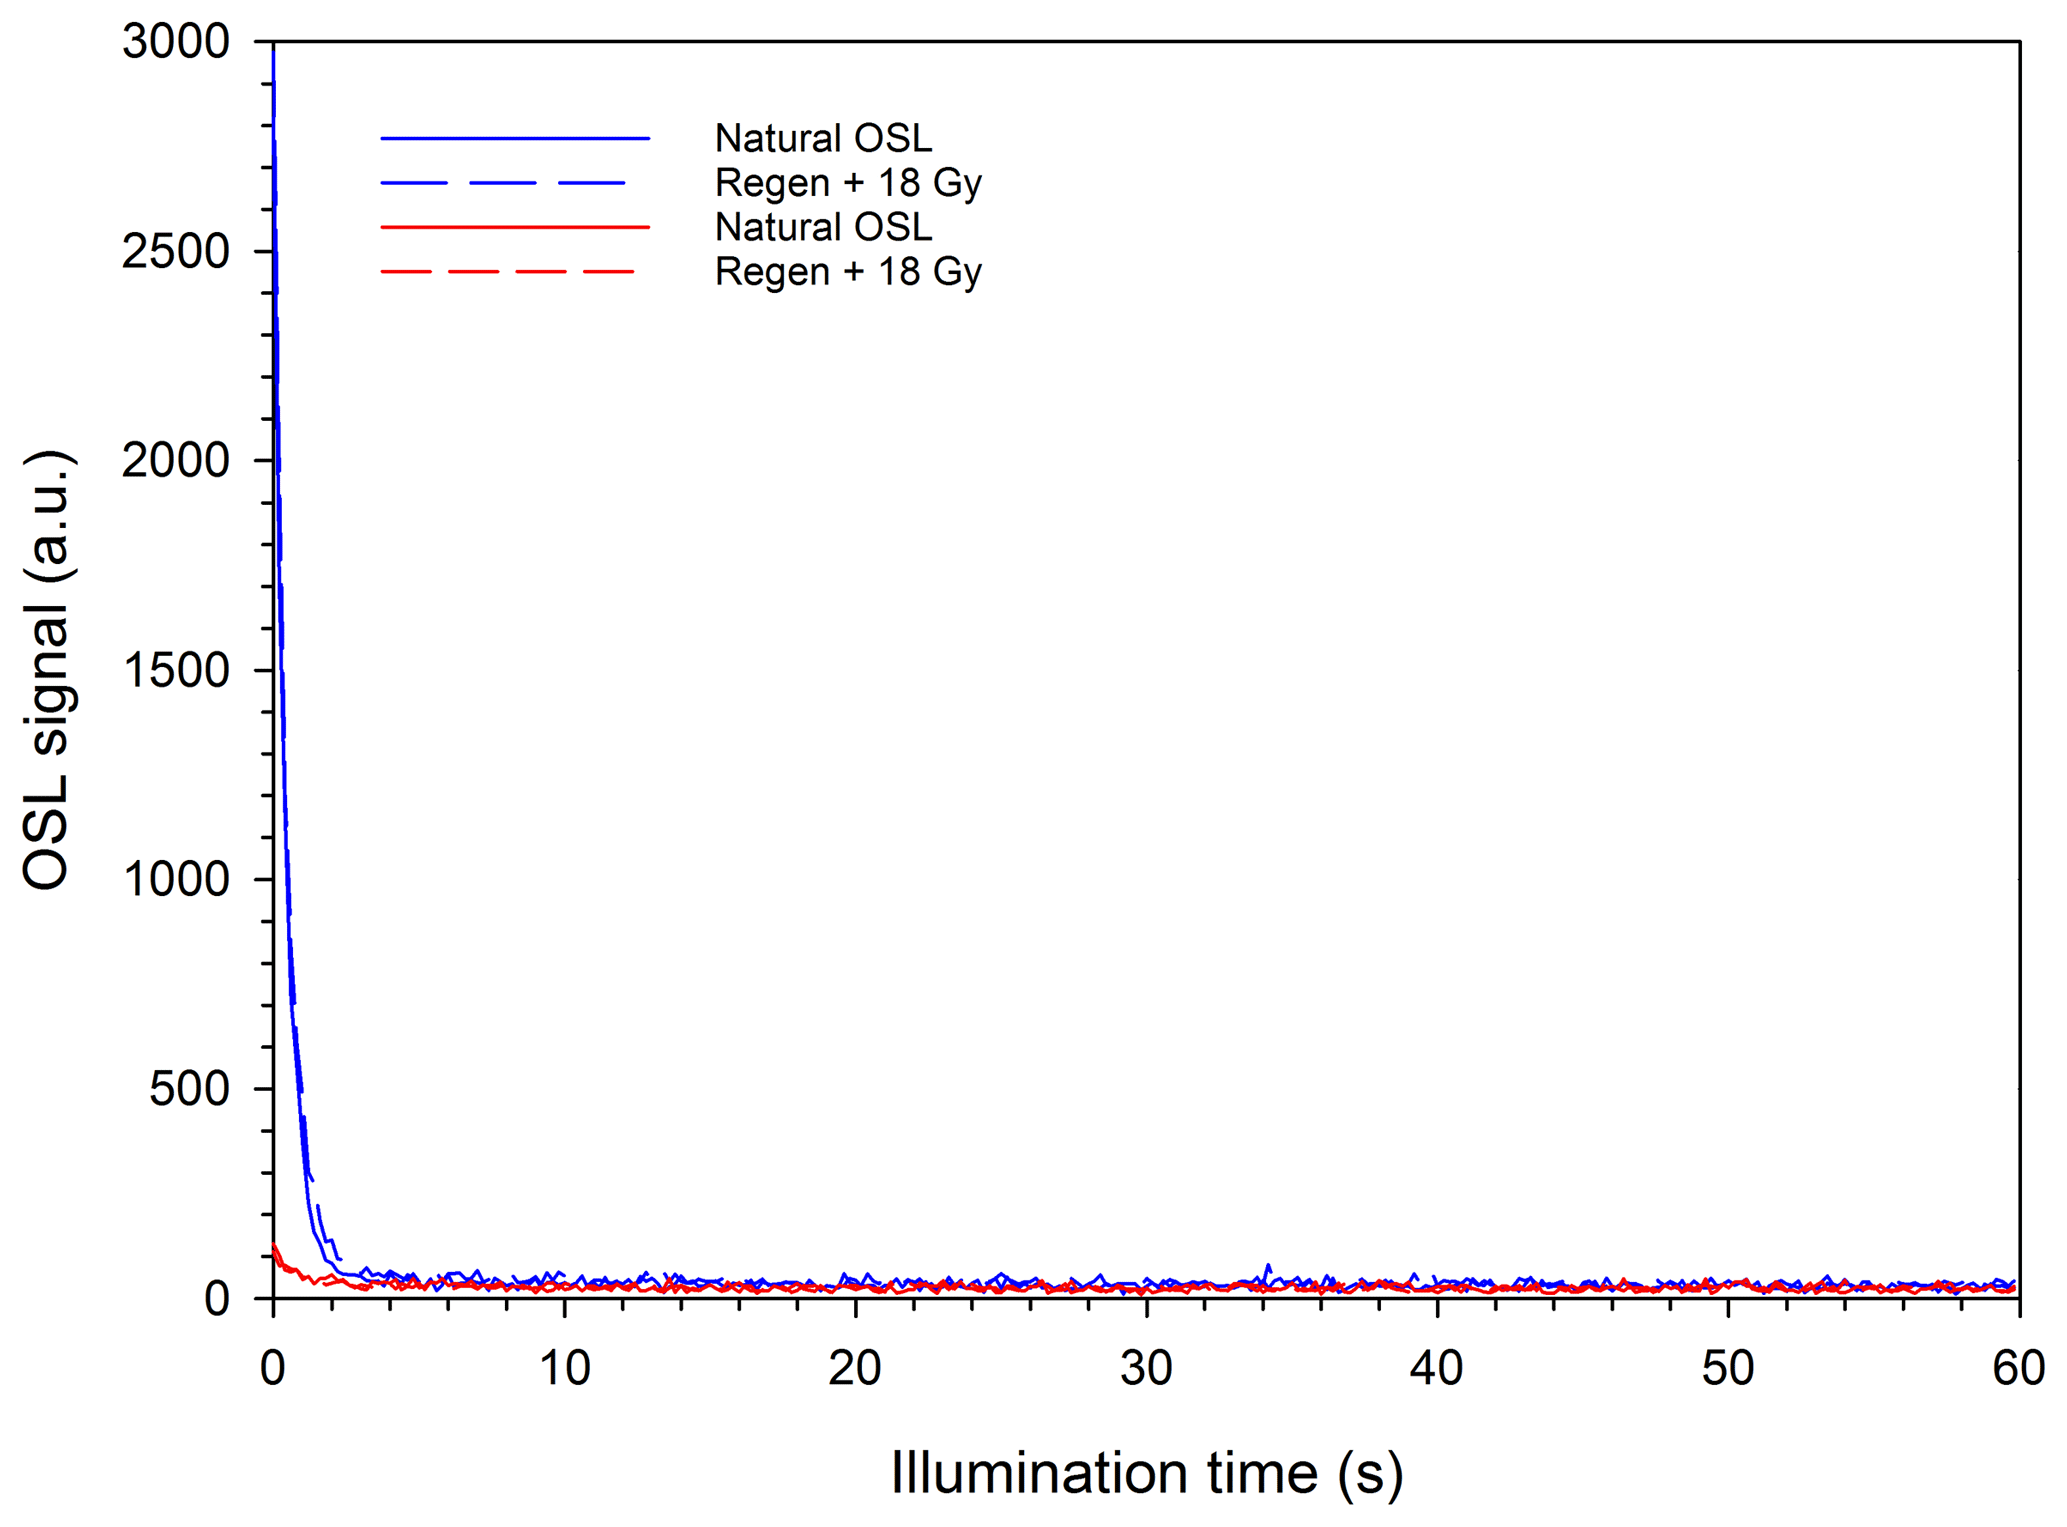
Figure 6While most OSL decay curves from the study area are relatively bright, some aliquots emit very low OSL intensities that make them unsuitable for De determination.
As the IR50 signal is often considered to be unstable, but applying a second stimulation at 225 ∘C (pIRIR225) after IR50 is expected to isolate a low- or even non-fading signal (Thomsen et al., 2008; Buylaert et al., 2009). For the pIRIR225 protocol, De calculation of multigrain aliquots (single grains) was based on the first 2 s (1 s) of the decay curve, and the last 20 s (2 s) were subtracted as background (Table 3). A major disadvantage of the pIRIR225 approach is its much slower resetting compared to IR50 (Buylaert et al., 2012) and hard-to-bleach natural residual doses are often observed. As natural residuals are constant and not a function of De, the problem of natural residuals decreases, while accumulated doses increase (Buylaert et al., 2009; Sohbati et al., 2012). While the applicability in glacial environments with low bleaching probabilities has proven problematic in previous studies (Blomdin et al., 2012; Lowick et al., 2012, 2015; Gaar et al., 2014), it is here further tested for completeness.
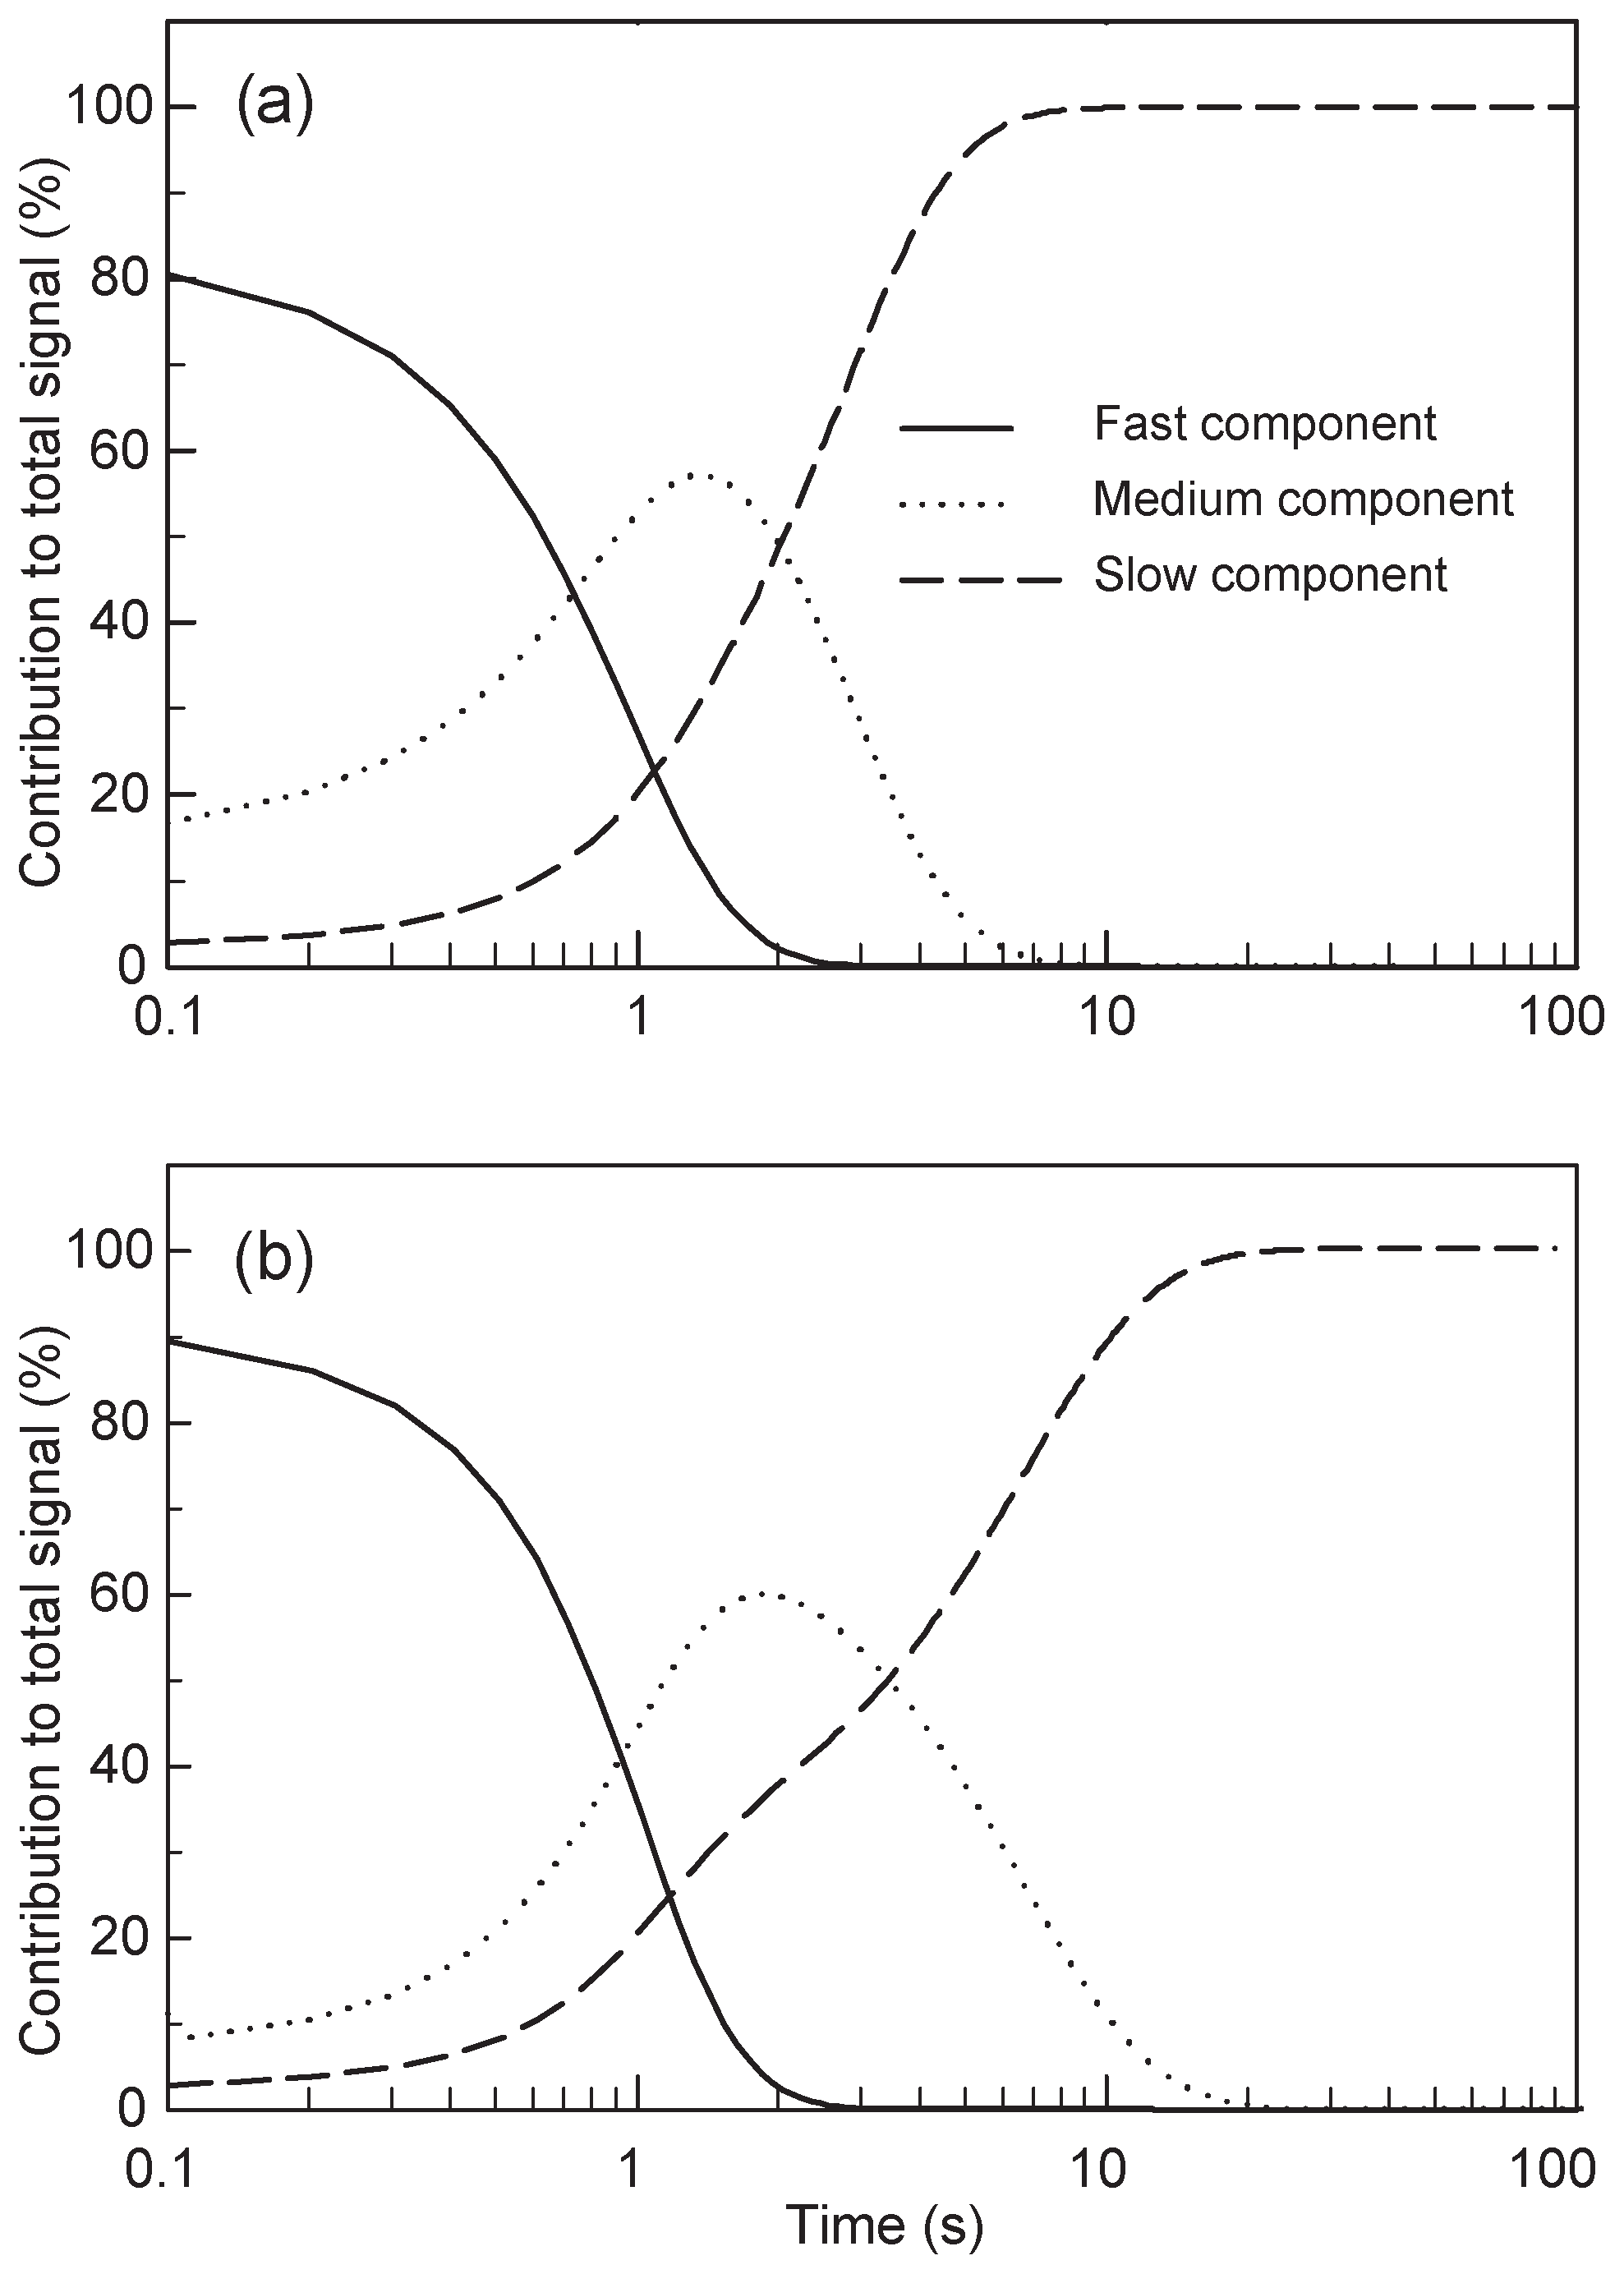
Figure 7Component stripping of quartz OSL signals reveals domination of the fast component. (a) BIR-3 fine-grain quartz, (b) MÜB-5 coarse-grain quartz.
Table 3Protocols used in this study. OSL was applied to quartz, IR50 and pIRIR225 were applied to feldspar. OSL is a stimulation with blue LEDs and SG OSL with a green laser. IRSL is a stimulation with IR LEDs and SG IRSL with an IR laser.
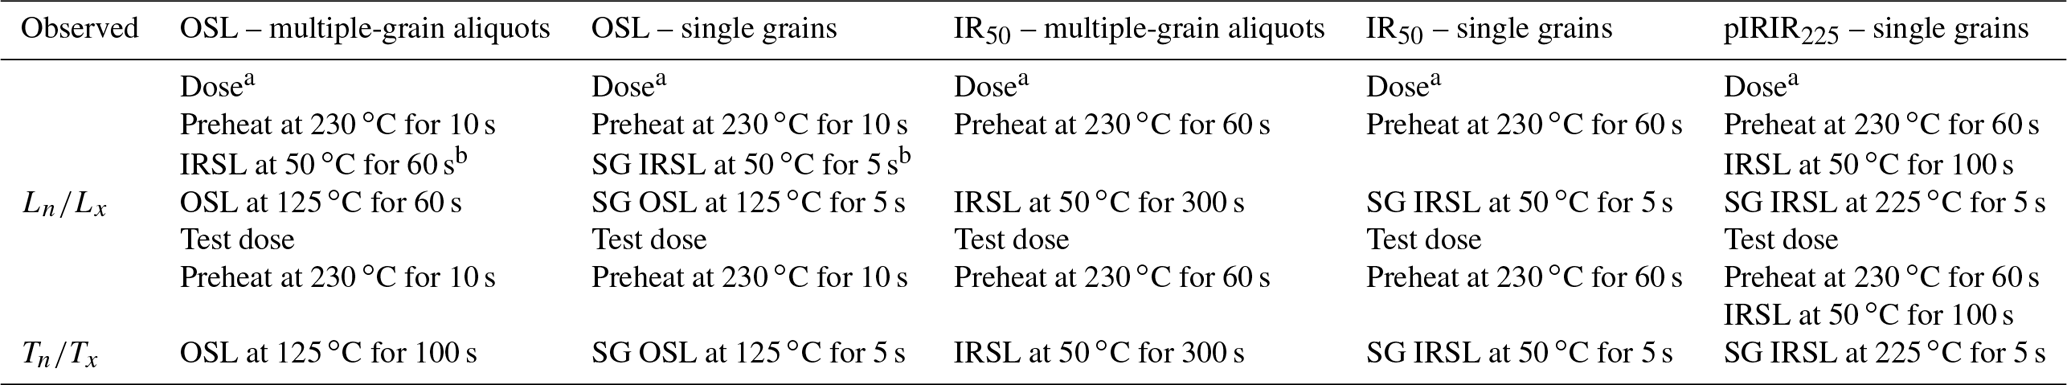
a Omitted in first cycle to measure Ln. b Only applied in last cycle.
Validity of the above parameters for samples from the area of interest has been outlined by Gaar et al. (2014) and confirmed by dose recovery experiments on selected samples, as detailed below. Dose response curves were fitted using a single saturating exponential function for both quartz and feldspar, examples being displayed in Fig. 8. A measurement error of 1.5 % was included in the De determination for single-aliquot measurements and 2.4 % for single grains according to Trauerstein et al. (2012); the error on curve fitting based on Monte Carlo simulation is included.
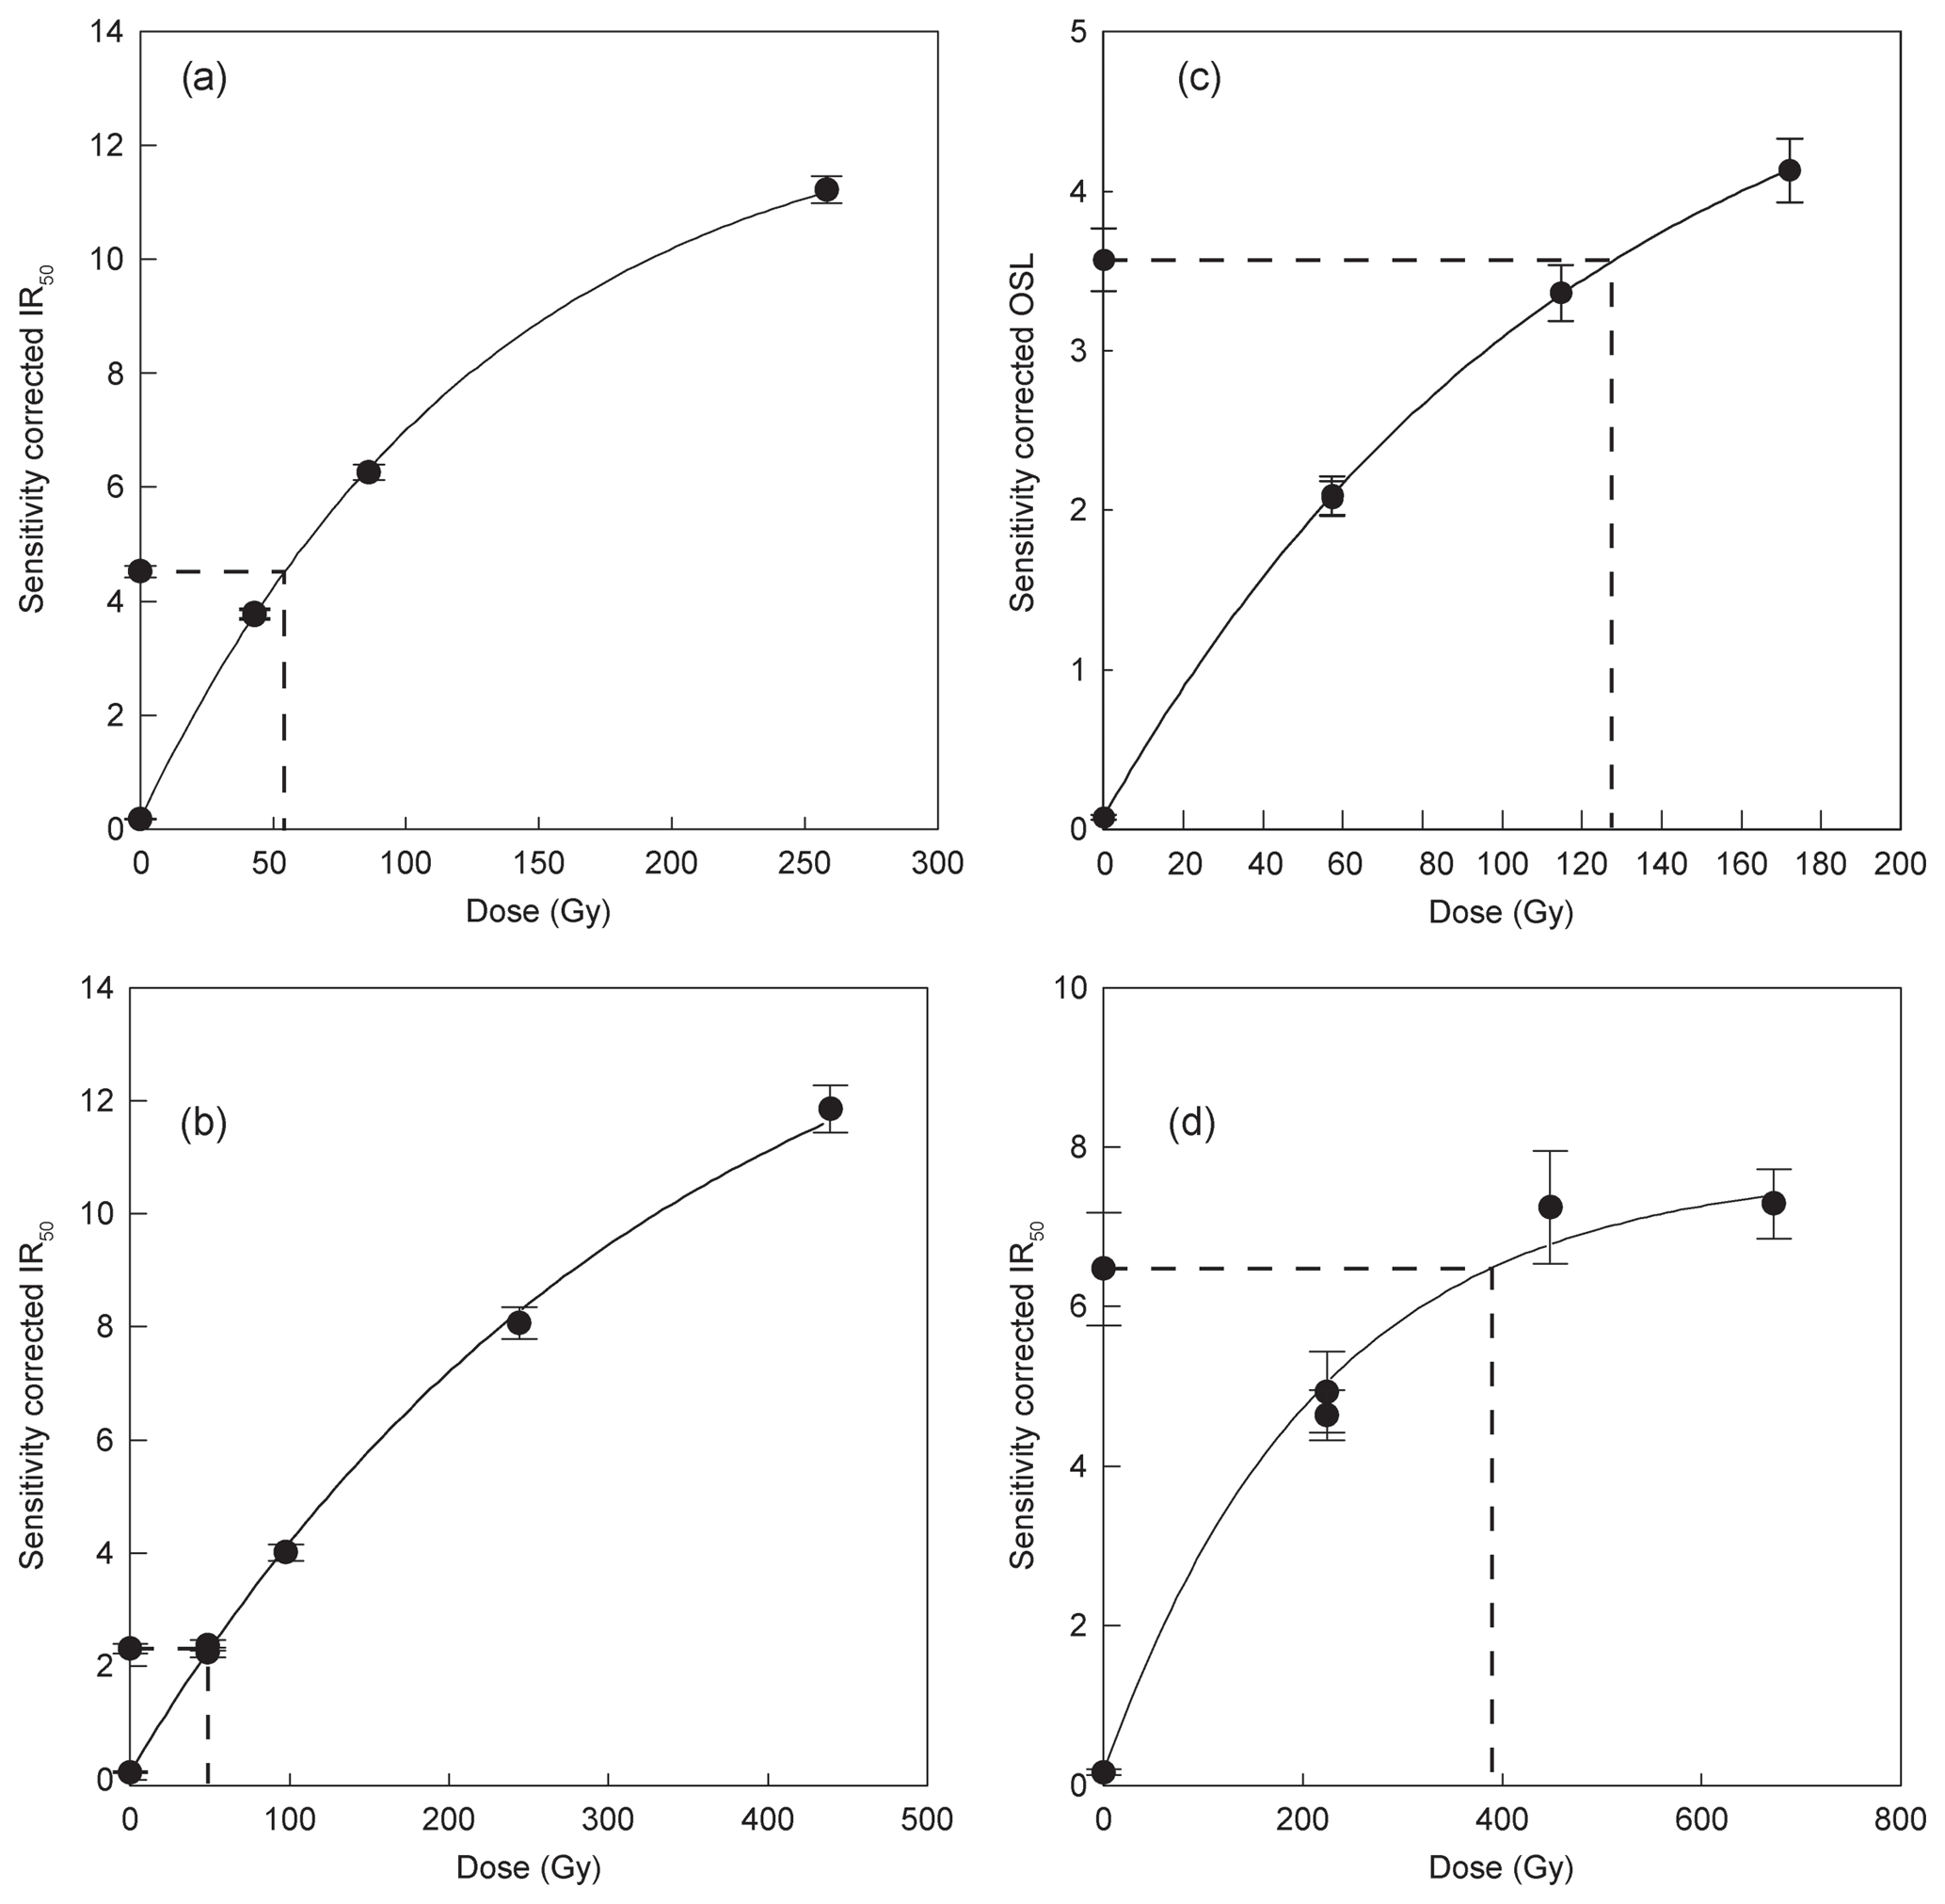
Figure 8Examples of dose response curves. (a) BIR-3 polymineral IR50, (b) SZB-1 feldspar, multiple-grain IR50, (c) MÜB-6 quartz, multiple-grain OSL and (d) RÜT-1 feldspar, single-grain IR50.
3.4 Partial bleaching
In glaciofluvial environments, incomplete signal resetting due to short transport distances is a common phenomenon (e.g. Fuchs and Owen, 2008). This means that many grains were only reset to a certain degree and not accounting for it would lead to age overestimation (e.g. Duller, 2006). However, it is usually assumed that there is a portion of grains that were exposed to daylight sufficiently long enough to fully reset the signal (Duller, 1994). When partial bleaching is recognised, the population of the fully reset grains can be obtained, for example, by using the Minimum Age Model (unlogged MAM-3) by Galbraith et al. (1999).
A basic assumption for the application of the MAM is that De is derived from individual grains and not as an average from several grains. In the latter case, averaging effects will likely mask the spread of De values caused by differential bleaching and it might hence not be possible to extract the dose accumulated during burial (Wallinga, 2002). This would, in principle, require the exclusive use of a single-grain over multigrain methodology for partially bleached samples, but single-grain dating is not only laborious but also subject to some methodological concerns (e.g. Thomsen et al., 2016). In this context, it is important to note that it has repeatedly been shown that only a small proportion of all grains emit luminescence (e.g. Duller, 2008), and averaging effects will be proportional to the number of grains contributing to the signal (Wallinga, 2002). For samples from the study area, Gaar et al. (2014) and the data presented here (Table 4) reveal that on average 2.6 % of all measured quartz grains and about 20 % of all feldspar grains have OSL and IRSL signals significantly above background. Calculating the number of grains on a multigrain disc following Heer et al. (2012), for the grain size (200–250 µm) and aliquot sizes used here, results in average numbers of 72 (quartz, 2 mm) and 18 (feldspar, 1 mm) grains per disc. Using the number of grains contributing significantly to the signal emitted from a multigrain disc as given above indicates that the signal of multigrain aliquots used in the present study should on average originate from ca. 2 (quartz) and ca. 3.5 (feldspar) grains, respectively. This implies that averaging effects for the geometry chosen here should be quite limited. This is confirmed by Gaar et al. (2014), who could clearly distinguish between a well and poorly bleached sample base on the spread of De values for both single grains and 1 mm aliquots of K-feldspar.
Table 4Doses and ages.
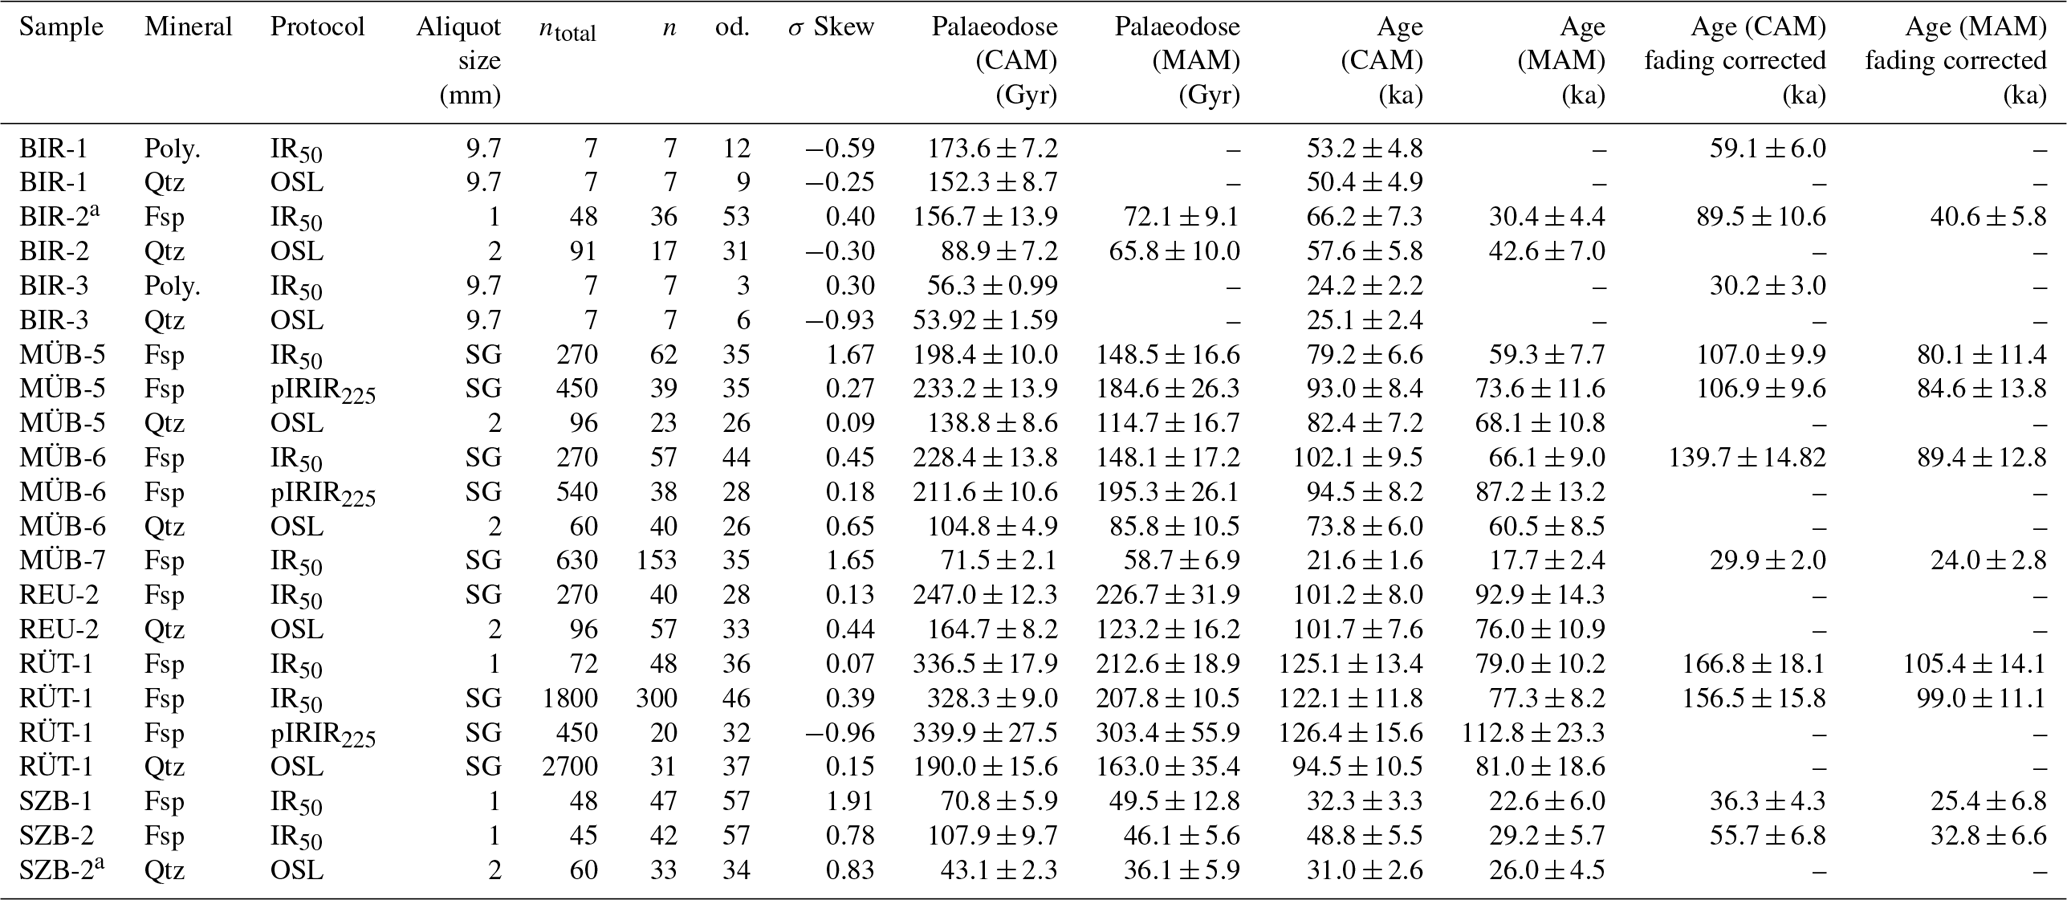
a Dose distribution has been manually changed by removing single outliers from the lowermost end.
Here, identification of partial bleaching is mainly based on Gaar et al. (2014), who investigated glaciofluvial samples within the same source area. A critical value is σb, which is used in the statistical models to define the expected variation of data. In this study, σb values exceeding 0.18 for 1 mm feldspar aliquots, 0.19 for 2 mm quartz aliquots, 0.32 for single grains of quartz and 0.28 for single feldspar grain are interpreted as indicative of partial bleaching. These values have been used as threshold and input parameter when applying the MAM. For samples with σb values smaller than the above and for all fine-grain samples, the Central Age Model (CAM; Galbraith et al., 1999) was used.
The SZB samples are from the Aare Valley and thus from another sediment source to the rest of the samples. Hence, the σb parameter derived for Birrfeld samples cannot be expected a priori to be valid for samples from another area. For the SZB feldspar samples, an approximation to a realistic σb, representative of the natural spread of De values for bleached samples was possible by manually removing the uppermost values from the De distribution of SZB-1 that were clearly separated from the rest of the De distribution, assuming these values derive from grains that were incompletely bleached. This resulted in a σb value of 0.39 for feldspar IR50 multigrain aliquots, which is substantially higher than for the Birrfeld samples, and is considered to possibly overestimate the real σb value of a well-bleached sample. Using this as input parameter in the MAM may hence result in an overestimated, maximum age estimate.
While the choice of the input parameter for the MAM is based on the information available, it is not unproblematic to assume that values observed for one sample automatically applied to another. As an independent test, we additionally follow Murray et al. (2012), who suggest that partial bleaching can be tested by comparing results for feldspar and quartz, as the minerals have different bleaching rates.
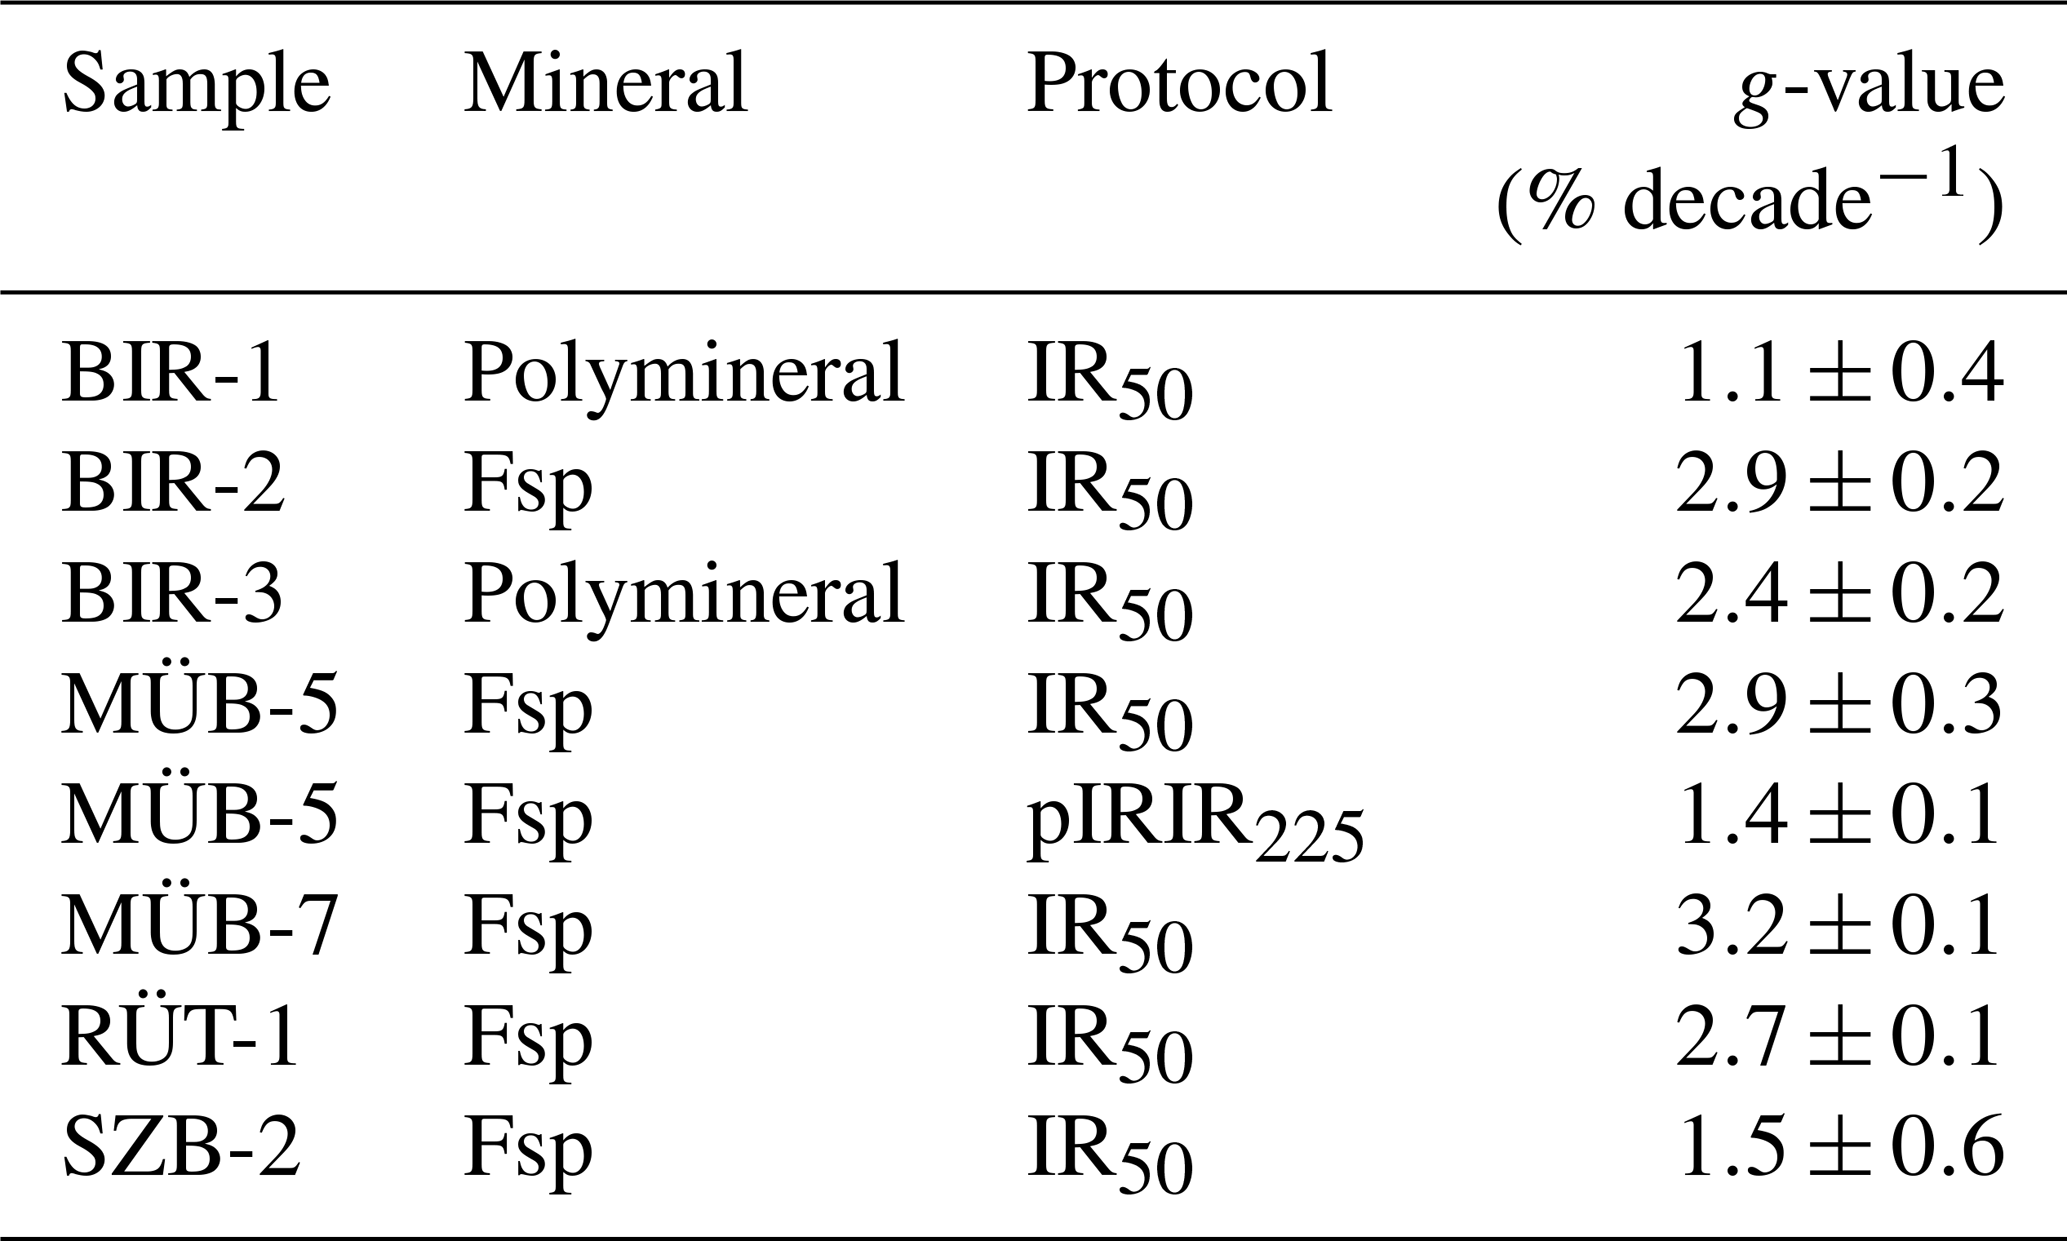
3.5 Fading of IR signals
Fading tests on multigrain aliquots were carried out on the feldspar and polymineral fraction of samples from all sites in order to detect and quantify anomalous fading of the IR50 signals (and in one case pIRIR225). The fading tests were based on delayed Lx∕Tx measurements, with preheating directly following irradiation (similar to natural dose) and different storage times prior to Lx measurements (Auclair et al., 2003). Delay of the measurements was up to 40 h after irradiation. The Lx∕Tx ratios measured after different delays are plotted against the time delay between irradiation and IR50 measurement on a log scale. The calculated percentage of signal loss per decade is referred to as the g-value (Aitken, 1985). Results of the fading tests are given in Table 5. These g-values are used for fading correction using the R package Luminescence (Kreutzer et al., 2012), which corrects according to Huntley and Lamothe (2001). This correction, however, is restricted to doses which lie within the linear part of the dose response curve (Huntley and Lamothe, 2001). In general, there is controversy around whether the assessment of g-values through laboratory experiments reflects the fading behaviour of samples in nature and if the correction always leads to accurate ages (e.g. Wallinga et al., 2007; Reimann et al., 2011; Lowick et al., 2012). Furthermore, it is has been questioned if g-values assessed on multigrain aliquots reflect the fading behaviour of the IRSL signal excited by a laser in single-grain measurements (Trauerstein et al., 2012). Nevertheless, the correction after Huntley and Lamothe (2001) was applied, although most of the samples are in the non-linear part of signal growth. This theoretically leads to undercorrection of the signal loss; hence, even corrected IR50 age may underestimate the real deposition age.
For samples from northern Switzerland, observations regarding fading correction are controversial. Gaar et al. (2014) found fading-corrected IR50 ages in good agreement with quartz OSL ages for two samples with a known age between 30 and 20 ka. On the other hand, several other studies found an age overestimation after fading correction and/or good agreement with independent age control from radiocarbon dating or quartz OSL (e.g. Preusser et al., 2003; Gaar and Preusser, 2012; Lowick et al., 2012, 2015; Veit et al., 2017). For this reason, we present both uncorrected and fading-corrected IR50 ages.
Results of luminescence dosimetry, statistical age models and calculated ages are given in Table 4. All De distributions are found in the Supplement of this article.
4.1 Gravel pit Joriacher (BIR)
Samples BIR-1 and BIR-3 are the only fine-grain samples presented in this study. Dose recovery tests yield recovery values of 96.8±3.7 % for BIR-1 and 94.5±4.1 % for BIR-3. Fading rates of the IR50 signal on the polymineral fraction were estimated to % per decade for BIR1 and 2.4±0.2 % for BIR3, which are relatively low and will have only a minor effect when applying age corrections. For fine grains it is not possible to detect partial bleaching by inspecting De distributions due to the large number of grains on each aliquot.
For BIR-1, a quartz OSL age of 50.4±4.9 ka is within uncertainties in good agreement with both the uncorrected (53.2±4.8 ka) and the fading-corrected (59.1±6.0 ka) IR50 ages. The same applies for sample BIR-3, with a quartz OSL age of 25.1±2.4 ka and polymineral IR50 ages of 24.2±2.2 ka (uncorrected) and 30.2±3.0 ka (fading corrected). BIR-2 bears some difficulty for interpretation as the quartz has low sensitivity and its data set contains only 17 De values. The IR50 on the feldspar fraction yielded more values, with a broad and skewed distribution indicating partial bleaching. One single outlier at the lower end of the distribution observed during visual inspection was discarded for further analysis to avoid strong biasing by this value (Fig. 9a). The quartz MAM age (42.6±7.0 ka) of this samples is based on rather few De values and should be taken with precaution. IR50 yields a MAM age of 30.4±4.4 ka (40.6±5.8 ka, corrected for fading).
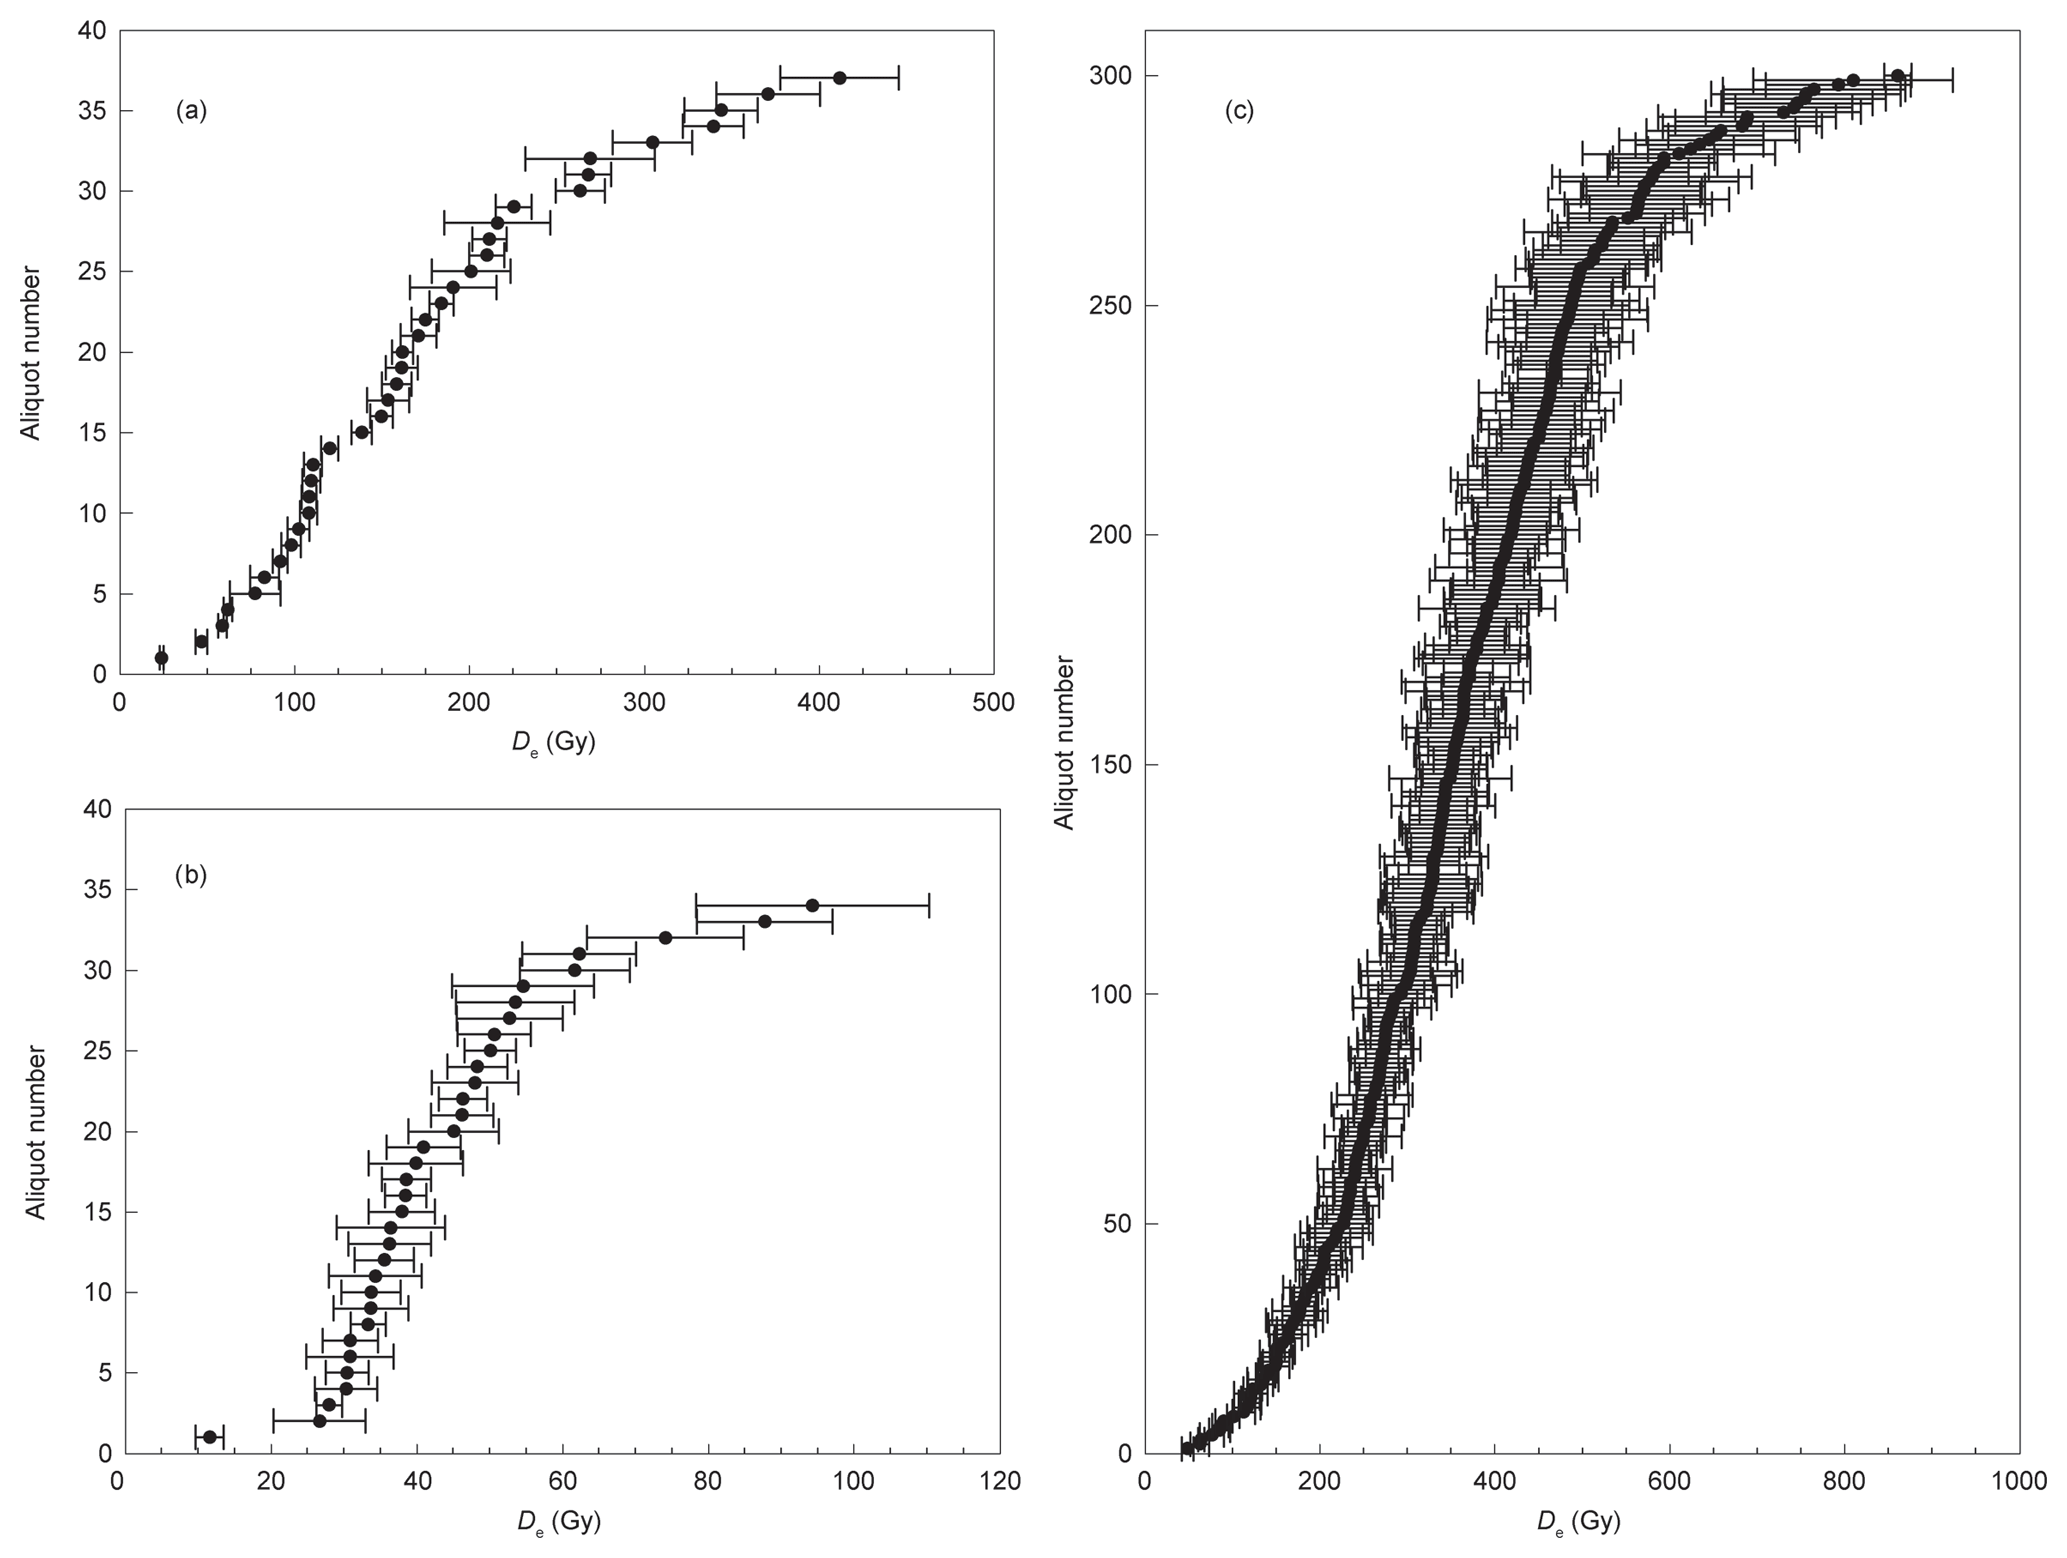
Figure 9De distributions of selected samples. (a) BIR-2 feldspar multiple-grain IR50, (b) SZB-2 quartz multiple-grain OSL, (c) RÜT-1 single-grain feldspar IR50.
4.2 Low Terrace in the Aare Valley (SZB)
The quartz data for sample SZB-1 had to be discarded due to a machine failure. Dose recovery of the quartz fraction is 97.4±6.8 % and the fading rate of the IR50 on the feldspar fraction was estimated to a low % per decade for SZB2.
For sample SZB-1, the De distribution of the IR50 1 mm feldspar aliquots show a tail of high doses. We interpret this as a typical distribution of a partially bleached sample, where a substantial part of the aliquots has been completely reset. The MAM age of this sample is 22.6±6.0 ka (25.4±6.8 ka, when corrected for fading).
For SZB-2, the quartz aliquot measurements show one clear single outlier at the lower end of the dose distribution that was discarded from further analysis (Fig. 9b). The remaining De distribution has an overdispersion of 27 %, larger than the value of 19 % expected for 2 mm quartz aliquots of a well-bleached sample in this area (Gaar et al., 2014). We consider the quartz fraction of this sample being reset to a large extent but still having an unbleached component. The MAM age of this sample 26.0±4.5 ka. The De distribution of the 1 mm feldspar aliquots (IR50) displays a wide range (overdispersion of 58 %) with some values at the upper end, implying the presence of partial bleaching. The MAM ages are 29.2±5.7 ka (uncorrected) and 32.8±6.6 ka (fading corrected).
4.3 Outcrop Mülligen (MÜB)
The De distribution of MÜB-5 quartz OSL 2 mm aliquots has an overdispersion of 26 %, slightly larger than the value of 19 % expected for a completely reset sample. Furthermore, the distribution is significantly positively skewed, and a partially bleached component is likely to be present in this distribution. A MAM age of 68.1±10.8 ka has been calculated. Single-grain feldspar measurements using the IR50 and pIRIR225 protocols return De distributions with higher overdispersion values of 38 % (IR50) and 35 % (pIRIR225) implying partial bleaching for these signals as well. Fading tests on the IR50 signal give a g-value of 2.9±0.3 % and 1.4±0.1 % per decade for the pIRIR225 signal. For IR50 an uncorrected MAM age of 59.3±7.7 ka was calculated, a correction (in the non-linear dose range) returns 80.1±11.4 ka. The pIRIR225 MAM age (73.6±11.6 ka) agrees with the quartz MAM age, whereas the corrected age (84.6±13.8 ka) tends to rather overestimate. Regarding the question of signal resetting it is noteworthy that, while some degree of partial bleaching is observed, in some the grains the pIRIR225 signal was completely bleached. A good performance of pIRIR225 is observed in the dose recovery test, where a given dose was recovered to 99 %.
Sample MÜB-6 is similar to MÜB-5, the overdispersion values of the De distributions are 26 % (quartz OSL, 2 mm aliquots), 44 % (feldspar IR50, single grains) and 28 % (pIRIR225, single grains). No fading test was done for this sample and IR50 is corrected using the fading rate obtained for MÜB-5. The MAM ages obtained for this sample are 60.5±8.5 ka (quartz OSL), 66.1±9.0 ka (IR50, uncorrected), 89.4±12.8 ka (IR50, corrected) and 87.2±13.2 ka (pIRIR225).
MÜB-7 was only measured using single feldspar grains with the IR50 protocol. Its distribution is positively skewed, and a couple of outliers can be identified at the upper end of the distribution. We interpret this sample as not being completely reset. The measured fading rate (3.2±0.1 g per decade) is the highest observed in this study and the fading-corrected MAM age is 24.0±2.8 ka, while the uncorrected age is 17.7±2.4 ka.
4.4 Reuss Valley (RÜT and REU)
For sample RÜT-1, only about 1 % of the investigated single quartz grains are acceptable for De analyses. The MAM age obtained for quartz OSL is 81.0±18.6 ka. The IR50 single-grain data set (Fig. 9c) of the same sample allows a solid estimation of the degree of bleaching as it offers a large number of De values. Its shape does not show a strongly positively skewed distribution but a very wide spread, spanning 1 order of magnitude between ca. 50 and over 800 Gyr. Since fading rates in the region are usually very similar (Gaar et al., 2014; Lowick et al., 2015) and internal K content of feldspars appears to be quite uniform (Gaar et al., 2014, and this study), the spread is most likely explained by different degrees of bleaching. The fading rate of the IR50 was estimated to 2.7±0.1 % g per decade with a dose recovery of 99 %. The IR50 MAM on the single feldspar grains yields an age of 77.3±8.2 ka (uncorrected) and 99.0±11.1 ka (fading corrected). For the 1 mm aliquots, very similar MAM ages of 79.0±10.2 ka (uncorrected) and 105.4±14.1 ka (fading corrected) are calculated; similarly to the distributions of BIR-2 and SZB-2, a single outlier at the lower end of the distribution was identified and removed for further analysis.
The pIRIR225 analysis on single grains of RÜT-1 yielded a low sensitivity, with ca. 4 % of the grains giving acceptable signals. Dose recovery of pIRIR225 single grains is 100 %. The data set of 20 De values does likely not reflect a representative dose distribution and the MAM age of 112.8±23.3 ka overestimates the ages obtained for OSL and IR50. This might be explained either by lower resetting probability of the pIRIR225 signal and/or the small data set not covering a sufficiently large population of fully reset grains.
Sample REU-1 is a replicate sample of REU-2 and due a shortage of machine time, this sample was not further investigated. The single-grain IR50 De distribution of sample REU-2 has an overdispersion of 28 %, which is similar to the overdispersion of other well-bleached samples in the area. We consider this sample to be well bleached and the single-grain IR50 CAM age of 101.2±8.0 ka agrees very well with the CAM age obtained from 2 mm quartz aliquots of 101.7±7.6 ka.
5.1 Methodological considerations
For our samples, we did not encounter the problem with an absence of quartz OSL sensitivity as reported in other studies from glacially derived sediments (Spencer and Owen, 2004; Lukas et al., 2007; Rowan et al., 2012; Klasen et al., 2016). One reason for low OSL sensitivity appears to be related to the sedimentary history of the quartz grains with repeated cycles of erosion, transport, deposition and burial increasing sensitivity (Preusser et al., 2006; Pietsch et al., 2008). While the glaciers responsible for the deposition of the sediments investigated here have their origin in the central Alps, a large number of the grains will originate from Molasse sediments, as has been shown for other sediments from the Swiss Alpine Foreland (e.g. Preusser et al., 2001). Molasse sediments were eroded and deposited in the foreland during growth of the Alps (Oligocene-Miocene) and therefore have undergone several sedimentary cycles prior to their initial deposition. Practically problematic is the small fraction of quartz grains giving an OSL signal, which increases measurement time for single-grain quartz analyses.
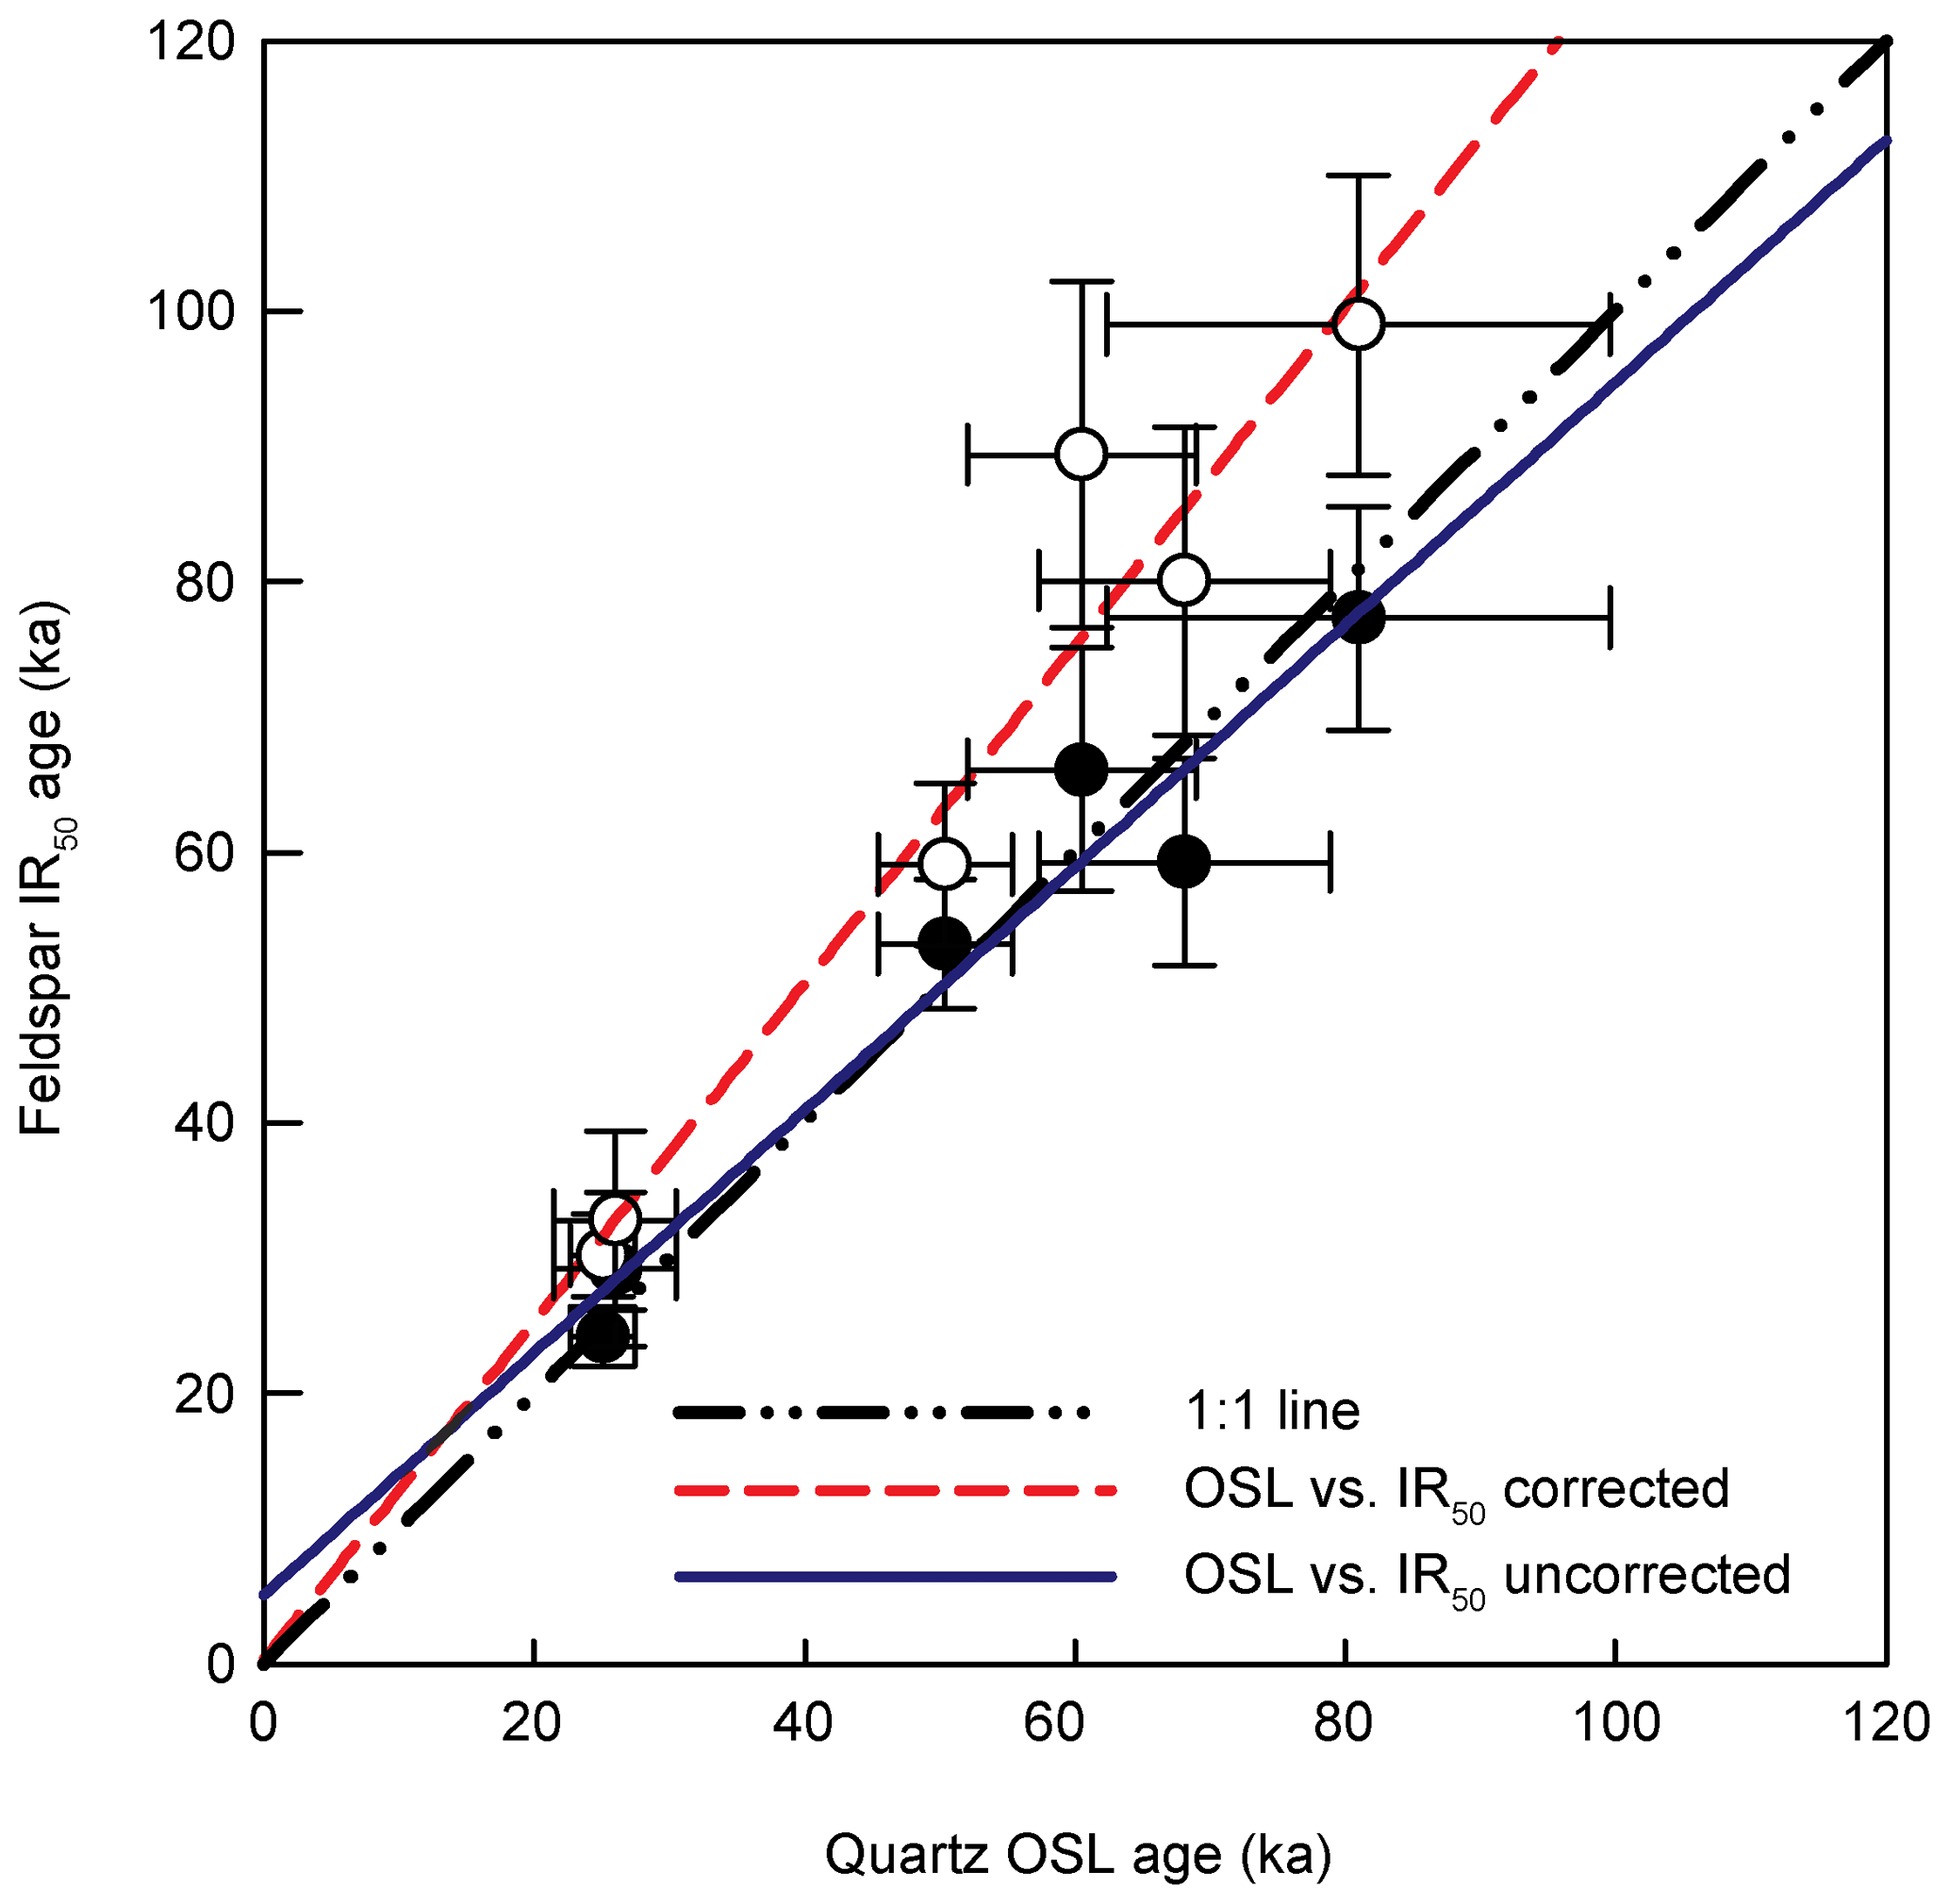
Figure 10Quartz OSL age plotted vs. uncorrected (black circles) and fading-corrected (open circles) feldspar IR50 age (both multiple and single grain). Note the consistency of quartz OSL ages with uncorrected IR50 ages. Functions of the regressions lines are IR50 uncorrected = and IR50 corrected = (r2=0.95 for both regressions).
Fading rates of the IR50 signals are relatively low with values between ca. 1 % and 3 %. The comparison of uncorrected and corrected IR50 age estimates with the corresponding quartz OSL ages is plotted in Fig. 10, revealing that fading-corrected IR50 ages have a tendency to overestimate the OSL ages. Assuming the effect of partial bleaching has been adequately considered, this implies little if any fading in the IR50 feldspar signal during burial. As already stated by Lowick et al. (2012) and others, g-values may not fully represent the potential signal loss occurring in nature, at least for the samples investigated here and in other parts of the northern Alpine foreland. Hence, while not applying a correction may cause age underestimation, the fading correction can lead to an overestimation in the real age of deposition, as reported by Klasen et al. (2016) and Lowick et al. (2015). This issue will require further systematic investigations.
A substantial portion of our samples that show indication of partial bleaching (BIR-2, MÜB-5-7, SZB-1 and 2) was sampled from homogeneous sand layers in gravel successions, which indicate proximal, high-energetic meltwater. Our findings are in contrast with observations from the southern Scandinavian Ice Sheet, where good bleaching is found for glaciofluvial samples after short transport distances (e.g. Alexanderson and Murray, 2012). A possible explanation would be that glaciers from the foreland of the Swiss Alps were characterised by meltwater channels with relatively small surfaces, often limited by pronounced relief. For the margin of the Scandinavian Ice Sheet, extended outwash plains with low relief (sandur) are expected. The large surface of the ice shield likely also induced katabatic winds and related aeolian reworking in the outwash plains, greatly increasing the probability of signal resetting as discussed by Lüthgens et al. (2011).
5.2 The last glacial advance
Sample BIR-1 (OSL: 50.4±4.9 ka; IR50: 53.2±4.8 ka) gives a minimum age estimate for soil formation and the massive gravel deposition below but, due to the lack of suitable layers for dating, the age of this horizon is not further constrained. Sample BIR-2 represents an early phase of aggradation (IR50: 30.4±4.4 ka) of glaciofluvial gravel, similar to ages of ca. 27 to 29 ka reported from the northern part of Birrfeld (Gaar et al., 2014). Gravel aggradation in the neighbouring Aare Valley (SZB-1: IR50: 22.6±6.0 ka, SZB-2 OSL: 26.0±4.5 ka, IR50: 29.2±5.7 ka) also occurred during this early phase. The maximum ice extent at the type locality of the Birrfeld glaciation is constrained by sample BIR-3 with consistent OSL ages of 25.1±2.4 ka and IR50 24.2±2.2 ka consistent for sediment just above till. This implies that the maximum ice extent in the study was reached earlier than the global LGM (Fig. 11), dated to 22–19 ka (Yokoyama et al., 2000). This offset is also observed in many other parts of the Alps, as discussed above. It appears that Alpine glaciers reacted faster to climate change compared to the large ice sheets that reached their maximum about 21 ka ago (e.g. Hughes et al., 2016).

Figure 11Ages obtained in this study compared to the LR04 global stack of benthic δ18O data as a proxy for global ice volume (Lisiecki and Raymo, 2005) and the climatic history of the northern Alpine foreland according to palynostratigraphy (closed circles indicate dated periods, open circles non-dated vegetational periods) compiled by Preusser (2004).
Analysing the temporal and spatial reconstruction of Rhine Glacier (Fig. 2) indicates that ice advanced over ca. 160 km, the distance from Chur to the maximal extent, within 6000 years. This corresponds to an advance of the ice front of some 10 m per year, which represents the fastest advance rates estimated for late Holocene Alpine glaciers (Holzhauser, 1995). Such a rapid rate of advance implies that glaciers were warm based, as cold-based glaciers are unlikely to move at such a speed. In this context it is interesting to note that typical outcrops in the northern Alpine foreland often show massive accumulation of glaciofluvial gravel covered by thick till layers that form the present land surface in many areas (e.g. Preusser et al., 2003, 2007, 2011). By contrast, gravel associated with the recession phase, as observed at Birrfeld (Fig. 4), is relatively scarce. It is to hypothesise that the massive aggradation of glaciofluvial sediment below till reflects the warm-based nature of alpine glaciers during their advance. The common absence of such deposits on top of till, representing maximum extent and subsequent meltdown, may indicate that several parts of the glaciers had cold-based ice. An explanation for such a hypothesis might be that the southward shift of the polar front turned the northern foreland into an arctic desert, cutting off the moisture supply with lowering temperatures at the same time. This would have also led to a situation in which humid air from the south precipitates over the main chain and crosses the Alps into the northern foreland as warm dry fall winds (foehn). Reduction in precipitation on the northern side of the Alps combined with dry winds from the south could have led to substantial sublimation of the ice (desiccation of the foreland glaciers), explaining the common lack of meltwater deposits during ice decay.
5.3 Evidence for earlier glacier advances
The melt-out till at Rütihof (RÜT-1) reveals consistent quartz and feldspar ages of about 80 ka that may overestimate rather than underestimate the real deposition age. Considering the environmental history of the Alps (cf. Preusser, 2004) implies a likely correlation to the cold phase of MIS 4 (71–54 ka). At Mülligen, sediments interpreted to indicate an approaching glacier (MÜB-5, MÜB-6) also have consistent quartz and feldspar ages, representing a mean of ca. 64 ka. All available ages are clearly younger than MIS 6 when compared to other studies from the region (e.g. Lowick et al., 2015). Our evidence for substantial glaciation of the Swiss Alpine Foreland during MIS 4 is in concert with other reports from the Western Alps (e.g. Mandier et al., 2003; Preusser et al., 2007), but it is in contradiction to findings from the Eastern Alps. For example, Starnberger et al. (2013) explicitly state that there is no indication of an ice advance into the Inn Valley between the Last Interglacial and MIS 2. If all these observations are correct, the apparent discrepancy might be explained by a different source of humidity during MIS 4 compared to MIS 2. Possibly, the southward shift of the polar front, as to be expected for MIS 4, did not reach as far south as during MIS 2. This could have resulted in a large moisture delivery to the western Alps. This excess of humidity would explain a larger MIS 4 glacier extent in the Lyon area compared to MIS 2, as this ice is expected to originate mainly from the Savoyan Alps (Coutterand et al., 2009), the first orographic obstacle where high precipitation would have occurred. The west–east trend of decreasing MIS 4 glaciation extension could also have had an additional topographic reason, as the accumulation areas in the eastern Alps are about 1000 m lower than in the west.
The age of ca. 100 ka for the REU sample (OSL: 101.7±7.6 ka, IR50: 101.2±8.0 ka) falls in the transition from MIS 5d to MIS 5c, a time considered to be cold, with open vegetation (Welten, 1981), for which a glacier advance in eastern Switzerland has been postulated (Preusser et al., 2003). However, a direct link between glacier presence in the foreland and the deposition of the dated sand is not possible.
Luminescence dating of glacial sediments remains challenging, as partial bleaching has to be identified and statistical age models need to be applied cautiously. It is shown here that the fading correction of feldspar IR50 ages tends to age overestimation compared to quartz OSL, whereas the uncorrected IR50 ages are mainly in better agreement with the latter. This confirms previous observations that fading determined in the laboratory rates may not necessarily represent signal loss occurring in nature. As in previous studies, there are indications that feldspar pIRIR225 is of limited use in sedimentary environments with low bleaching probabilities.
In this study, the last glacier advance of the Reuss Glacier into the Swiss Alpine Foreland at the type locality of the Birrfeld glacial is consistently dated by quartz OSL and feldspar IR50 to about 25 ka. This age is in good agreement with other age estimates, indicating that the maximum of the last glacier advance into the foreland of the NW Alps was reached before the global LGM. An earlier glacier advance is likely constrained to MIS 4. The apparent absence of this advance in the Eastern Alps might be explained by only a moderate southward shift of the polar front during MIS 4, bringing humidity mainly to the Western Alps.
All data relevant for this contribution are presented within the article itself or the Supplement.
The supplement related to this article is available online at: https://doi.org/10.5194/egqsj-68-53-2019-supplement.
DG carried out field work and processed, measured and analysed the samples. He wrote the first draft of the manuscript and developed most of the illustrations. HRG suggested field sites and joined the sampling. He contributed with text about the sampling sites and the regional geology. FP designed the project, secured funding and supervised DG during his PhD. He re-wrote part of the manuscript and developed Fig. 6 and the Supplement. All authors contributed to the discussion and interpretation of the presented research results.
The authors declare that they have no conflict of interest.
Naki Akçar is thanked for help with the recalculation of 10Be ages. Martin Robyr is thanked for guidance with the electron microprobe analysis. We thank Tony Reimann and two anonymous reviewers for their detailed constructive comments on earlier versions of the article.
This research has been supported by the Swiss National Science Foundation (grant no. 200021_126784 and 200020_144456). The article processing charge was funded by the German Research Foundation (DFG) and the University of Freiburg in the funding programme Open Access Publishing.
Aitken, M. J.: Thermoluminescence dating, Academic Press, London, 359 pp., 1985.
Alexanderson, H. and Murray, A. S.: Problems and potential of OSL dating Weichselian and Holocene sediments in Sweden, Quaternary Sci. Rev., 44, 37–50, 2012.
Auclair, M., Lamothe, M., and Huot, S.: Measurement of anomalous fading for feldspar IRSL using SAR, Radiat. Meas., 37, 487–492, 2003.
Balco, G., Stone, J. O., Lifton, N. A., and Dunai, T. J.: A complete and easily accessible means of calculating surface exposure ages or erosion rates from 10Be and 26Al measurements, Quat. Geochronol., 3, 174–195, 2008.
Balco, G., Briner, J., Finkel, R. C., Rayburn, J. A., Ridge, J. C., and Schaefer, J. M.: Regional beryllium-10 production rate calibration for late-glacial northeastern North America, Quat. Geochronol., 4, 93–107, 2009.
Bausch, W., Geyer, O. F., Schober, T., and Schreiner, A.: Zur Geologie des badischen Klettgaus, Jahresb. Mitt. Oberrhein. Geol. Ver. NF, 71, 199–224, 1989.
Becker, P., Seguinot, J., Jouvet, G., and Funk, M.: Last Glacial Maximum precipitation pattern in the Alps inferred from glacier modelling, Geogr. Helv., 71, 173–187, https://doi.org/10.5194/gh-71-173-2016, 2016.
Bini, A., Buoncristiani, J.F., Coutterand, S., Ellwanger, D., Felber, M., Florineth, D., Graf, H. R., Keller, O., Kelly, M., Schlüchter, C., and Schoeneich, P.: Die Schweiz während des letzteiszeitlichen Maximums (LGM) (Map 1:500 000), swisstopo, Wabern, 2009.
Blair, M. W., Yukihra, E. G., and McKeever, S. W. S.: Experiences with single-aliquot OSL procedures using coarse-grain feldspars, Radiat. Meas., 39, 361–374, 2005.
Blomdin, R., Murray, A., Thomsen, K. J., Buylaert, J. P., Sohbati, R., Jansson, K. N., and Alexanderson, H.: Timing of the deglaciation in southern Patagonia: Testing the applicability of K-Feldspar IRSL, Quat. Geochronol., 10, 264–272, 2012.
Bøtter-Jensen, L., Andersen, C. E., Duller, G. A. T., and Murray, A. S.: Developments in radiation, stimulation and observation facilities in luminescence measurements, Radiat. Meas., 37, 535–541, 2003.
Bronk Ramsey, C.: Bayesian Analysis of Radiocarbon Dates, Radiocarbon, 51, 337–360, 2009.
Burga, C. A.: Glazialmorphologische Untersuchungen im Hinterrhein-Tal und am Bernhardina-Pass, Vierteljahrsschr. Naturforsch. Ges. Zürich, 126, 237–267, 1981.
Buylaert, J. P., Murray, A. S., Thomsen, K. J., and Jain, M.: Testing the potential of an elevated temperature IRSL signal from K-feldspar, Radiat. Meas., 44, 560–565, 2009.
Buylaert, J. P., Jain, M., Murray, A. S., Thomsen, K. J., Thiel, C., and Sohbati, R.: A robust feldspar luminescence dating method for Middle and Late Pleistocene sediments, Boreas, 41, 435–451, 2012.
Clark, P. U., Dyke, A. S., Shakun, J. D., Carlson, A. E., Clark, J., Wohlfarth, B., Mitrovica, J. X., Hostetler, S. W., and McCabe, A. M.: The Last Glacial Maximum, Science, 325, 710–714, 2009.
Coutterand, S., Schoeneich, P., and Nicoud, G.: Le lobe glaciaire lyonnais au maximum würmien: glacier du Rhône ou/et glaciers savoyards?, in: Neige et glace de montagne. Reconstitution, dynamique, pratiques, edited by: Deline, P. and Ravanel, L., 9–20, Cahiers de Géographie ed. EDYTEM, Université de Savoie, Le Bourget du Lac Cedex, 2009.
de Graaf, L. W. S.: Zur Altersbestimmung eines Mammut-Stosszahns (Kiesgrube Hochwacht) und ihre Bedeutung für die mophostratigraphische Einstufung der Quartärablagerungen zwischen Bregenz und Langen, Schriften des Vorarlberger Landesmuseums, A5, 23–28, 1992.
de Graaf, L. W. S. and de Jong, M. G. G.: Notes on the Alpine Rhine glacier and the chronostratigraphy of the Upper Würm, Mededelingen Rijks Geologische Dienst, 52, 317–330, 1995.
Dehnert, A., Lowick, S. E., Preusser, F., Anselmetti, F. S., Drescher-Schneider, R., Graf, H. R., Heller, F., Horstmeyer, H., Kemna, H. A., Nowaczyk, N. R., Züger, A., and Furrer, H.: Evolution of an overdeepened trough in the northern Alpine Foreland at Niederweningen, Switzerland, Quaternary Sci. Rev., 34, 127–145, 2012.
de Jong, M. G. G.: Quaternary deposits and landforms of Western Allgäu (Germany) and the deglaciation after the last major Pleistocene ice advance, 186 pp., PhD thesis, Amsterdam, 1983.
Duller, G. A. T.: Luminescence dating of poorly bleached sediments from Scotland, Quaternary Sci. Rev., 13, 521–524, 1994.
Duller, G. A. T.: Single grain optical dating of glacigenic deposits, Quat. Geochronol., 1, 296–304, 2006.
Duller, G. A. T.: Single-grain optical dating of Quaternary sediments: why aliquot size matters in luminescence dating, Boreas, 37, 589–612, 2008.
Duller, G. A. T.: Luminescence Analyst, 4.11 edn., Aberystwyth University, Aberystwyth, 2013.
Ehlers, J. and Gibbard, P. L.: Quaternary Glaciations Extent and Chronology Part I: Europe, Developments in Quaternary Sciences, Elsevier, Amsterdam, 2004.
Federici, P. R., Granger, D. E., Ribolini, A., Spagnolo, M., Pappalardo, M., and Cyr, A. J.: Last Glacial Maximum and the Gschnitz stadial in the Maritime Alps according to 10Be cosmogenic dating, Boreas, 41, 277–291, 2012.
Fiebig, M. and Preusser, F.: The age of fluvial sediments from the Ingolstadt area (Bavaria) and their significance for the stratigraphy of the ice age in the Alpine foreland, Zeitschr. f. Geomorph, 47, 449–467, 2003.
Florineth, D. and Schlüchter, C.: Alpine evidence for atmospheric circulation patterns in Europe during the last glacial maximum, Quaternary Res., 54, 295–308, 2000.
Frank, S. and Rey, R.: N4 Flurlingen: Durch Tunnelbau beschleunigte Kriechbewegungen und deren Konsequenzen für die Bauausführung, in: Instabile Hänge und andere risikorelevante natürliche Prozesse, edited by: Verità, M., Birkhäuser, Basel, 1996.
Frenzel, B.: Über einen frühen letzteiszeitlichen Vorstoß des Rheingletschers in das deutsche Alpenvorland, in: Klimageschichtliche Probleme der letzten 130 000 Jahre, edited by: Frenzel, B., 377–400 pp., Gustav Fischer, Stuttgart, 1991.
Fuchs, M. and Owen, L. A.: Luminescence dating of glacial and associated sediments: review, recommendations and future directions, Boreas, 37, 636–659, 2008.
Gaar, D. and Preusser, F.: Luminescence dating of mammoth remains from northern Switzerland, Quat. Geochronol., 10, 257–263, 2012.
Gaar, D., Lowick, S. E., and Preusser, F.: Performance of different luminescence approaches for the dating of known-age glaciofluvial deposits from northern Switzerland, Geochronometria, 41, 65–80, 2014.
Galbraith, R. F., Roberts, R. G., Laslett, G. M., Yoshida, H., and Olley, J. M.: Optical dating of single and multiple grains of quartz from jinmium rock shelter, northern Australia, part 1, Experimental design and statistical models, Archaeometry, 41, 339–364, 1999.
Geyh, M. A. and Schreiner, A.: 14C-Datierungen an Knochen- und Stoßzahnfragmenten aus würmeiszeitlichen Ablagerungen im westlichen Rheingletschergebiet, Eiszeit. U. Gegenw., 34, 155–161, 1984.
Graf, H. R.: Die Deckenschotter der zentralen Nordschweiz, Diss. ETH Zürich, Zürich, 10205, 1993.
Graf, H. R.: Stratigraphie von Mittel- und Spätpleistozän in der Nordschweiz, 198 p. Landesgeologie, Wabern, 2009.
Haeberli, W.: Glaciological conditions in northern Switzerland during recent Ice Ages, NAGRA NAB 10–18, 28 pp., 2010.
Haeberli, W. and Schlüchter, C.: Geological evidence to constrain modelling of the Late Pleistocene Rhonegletscher (Switzerland), IAHS, Wallingford, 170, 333–346, 1987.
Headley, R. M. and Ehlers, T. A.: Ice flow models and glacial erosion over multiple glacial–interglacial cycles, Earth Surf. Dynam., 3, 153–170, https://doi.org/10.5194/esurf-3-153-2015, 2015.
Heer, A. J., Adamiec, G., and Moska, P.: How many grains are there on a single aliquot?, Ancient TL, 30, 9–16, 2012.
Holzhauser, H.: Gletscherschwankungen innerhalb der letzten 3200 Jahre am Beispiel des grossen Aletsch- und des Gornergletschers: neue Ergebnisse, in: Gletscher im ständigen Wandel, edited by: SANW, 101–122 pp., vdf Hochschulverlag AG an der ETH Zürich, Zürich, 1995.
Hughes, A. L. C., Gyllencreutz, R., Lohne, O. S., Mangerud, J., and Svendsen, J. I.: The last Eurasian ice sheets a chronological database and time-slice reconstruction, DATED-1, Boreas, 45, 1–45, 2016.
Hughes, P. D., Gibbard, P. L., and Ehlers, J.: Timing of glaciation during the last glacial cycle: evaluating the concept of a global “Last Glacial Maximum” (LGM), Earth-Sci. Rev., 125, 171–198, 2013.
Hünermann, K. A.: Eiszeit-Säugetiere aus dem Kanton Zürich, Vierteljahrsschr. Naturforsch. Ges. Zürich, 130, 229–250, 1985.
Huntley, D. J. and Baril, M. R.: The K content of the K-feldspars being measured in optical dating or in thermoluminescence dating, Ancient TL, 15, 11–14, 1997.
Huntley, D. J. and Lamothe, M.: Ubiquity of anomalous fading in K-feldspars and the measurement and correction for it in optical dating, Can. J. Earth Sci., 38, 1093–1106, 2001.
Ivy-Ochs, S., Schäfer, J., Kubik, P., Synal, H.-A., and Schlüchter, C.: Timing of deglaciation on the northern Alpine foreland (Switzerland), Eclogae Geol. Helv., 97, 47–55, 2004.
Ivy-Ochs, S., Kerschner, H., Reuther, A., Preusser, F., Heine, K., Maisch, M., Kubik, P. W., and Schlüchter, C.: Chronology of the last glacial cycle in the European Alps, J. Quat. Sci., 23, 559–573, 2008.
Jarvis, A., Reuter, H. I., Nelson, A., and Guevara, E.: Hole-filled seamless SRTM data V4. International Centre for Tropical Agriculture (CIAT), available at: http://srtm.csi.cgiar.org (last access: April 2012), 2008.
Jimenez-Sanchez, M., Rodriguez-Rodriguez, L., Garcia-Ruiz, J. M., Dominguez-Cuesta, M. J., Farias, P., Valero-Garces, B., Moreno, A., Rico, M., and Valcarcel, M.: A review of glacial geomorphology and chronology in northern Spain: Timing and regional variability during the last glacial cycle, Geomorphology, 196, 50–64, 2013.
Keller, O. and Krayss, E.: Datenlage und Modell einer Rhein-Linth-Vorlandvergletscherung zwischen Eem-Interglazial und Hochwürm, GeoArchaeoRhein, 2, 121–138, 1998.
Keller, O. and Krayss, E.: Der Rhein-Linth-Gletscher im letzten Hochglazial 1. Teil: Einleitung, Aufbau und Abschmelzen des Rhein-Linth-Gletscher im Oberen Würm, Vierteljahrsschr. Naturforsch. Ges. Zürich, 150, 19–32, 2005a.
Keller, O. and Krayss, E.: Der Rhein-Linth-Gletscher im letzten Hochglazial 2. Teil: Datierung und Modelle der Rhein-Linth-Vergletscherung, Klima Rekonstruktionen, Vierteljahrsschr. Naturforsch. Ges. Zürich, 150, 69–85, 2005b.
Klasen, N., Fiebig, M., Preusser, F., Reitner, J. M., and Radtke, U.: Luminescence dating of proglacial sediments from the Eastern Alps, Quaternary Int., 164–165, 21–32, 2007.
Klasen, N., Fiebig, M., and Preusser, F.: Applying luminescence methodology to key sites of Alpine glaciations in Southern Germany, Quaternary Int., 420, 249–258, 2016.
Kock, S., Huggenberger, P., Preusser, F., Rentzel, P., and Wetzel, A.: Formation and evolution of the Lower Terrace of the Rhine River in the area of Basel, Swiss J. Geosci., 102, 307–321, 2009a.
Kock, S., Kramers, J. D., Preusser, F., and Wetzel, A.: Dating of Late Pleistocene terrace deposits of the River Rhine using Uranium series and luminescence methods: Potential and limitations, Quat. Geochronol., 4, 363–373, 2009b.
Köppen, W. and Wegener, A.: Die Klimate der geologischen Vorzeit, 257 pp., Gebrüder Borntraeger, Berlin, 1924.
Köppen, W. and Wegener, A.: Die Klimate der geologischen Vorzeit – Ergänzungen und Berichtigungen, 38 pp., Gebrüder Borntraeger, Berlin, 1940.
Kreutzer, S., Schmidt, C., Fuchs, M.C., Dietze, M., Fischer, M., and Fuchs, M.: Introducing an R package for luminescence dating analysis, Ancient TL, 30, 1–8, 2012.
Kuhlemann, J., Rohling, E.J., Krumrei, I., Kubik, P., Ivy-Ochs, S., and Kucera, M.: Regional synthesis of Mediterranean atmospheric circulation during the last glacial maximum, Science, 321, 1338–1340, 2008.
Kulig, G.: Erstellung einer Auswertesoftware zur Altersbestimmung mittels Lumineszenzverfahren unter spezieller Berücksichtigung des Einflusses radioaktiver Ungleichgewichte in der 238U-Zerfallsreihe, BSc thesis, Technische Bergakademie Freiberg, Freiberg, 2005.
Lapp, T., Jain, M., Thomsen, K. J., Murray, A. S., and Buylaert, J.-P.: New luminescence measurement facilities in retrospective dosimetry, Radiat. Meas., 47, 803–808, 2012.
Link, A. and Preusser, F.: Hinweise auf eine Vergletscherung des Kemptener Beckens (Südwest-Bayern) im Mittleren Würm, Eiszeit und Gegenw., 55, 64–87, 2005.
Lisiecki, L. E. and Raymo, M. E.: A Pliocene-Pleistocene stack of 57 globally distributed benthic delta O-18 records, Paleoceanography, 20, PA1003, 2005.
Lister, G., Kelts, K., Schmid, R., Bonani, G., Hofmann, H., Morenzoni, E., Nessi, M., Suter, M., and Wolfli, W.: Correlation of the Paleoclimatic Record in Lacustrine Sediment Sequences – 14C Dating by AMS, Nucl. Instrum. Meth B, 5, 389–393, 1984.
Lowick, S. E., Trauerstein, M., and Preusser, F.: Testing the application of post IR-IRSL dating to fine grain waterlain sediments, Quat. Geochronol., 8, 33–40, 2012.
Lowick, S. E., Büchi, M., Gaar, D., Graf, H. R., and Preusser, F.: Luminescence dating of Middle Pleistocene proglacial deposits from northern Switzerland: methodological aspects and stratigraphical conclusions, Boreas, 44, 459–482, 2015.
Lukas, S., Spencer, J. Q. G., Robinson, R. A. J., and Benn, D. I.: Problems associated with luminescence dating of Late Quaternary glacial sediments in the NW Scottish Highlands, Quat. Geochronol., 2, 243–248, 2007.
Lüthgens, C., Böse, M., and Preusser, F.: Age of the Pomeranian ice-marginal position in northeastern Germany determined by Optically Stimulated Luminescence (OSL) dating of glaciofluvial sediments, Boreas, 40, 598–615, 2011.
Mandier, P.: Reconstitution de l'expansion glaciaire de peidmont des stades. A et D des glaciers würmiens du Rhône et de l'Isère: implication et origine de leur disparité, Quaternaire 14, 129–133, 2003.
Mandier, P., Petiot, R., Argant, J., and Evin, J.: Chronostratigraphie des accumulations würmiennes dans la moyenne vallée du Rhône. L'apport des dates radiocarbon, Quaternaire, 14, 113–127, 2003.
Mauz, B., Packman, S., and Lang, A.: The alpha effectiveness in silt-sized quartz: New data obtained by single and multiple aliquot protocols, Ancient TL, 24, 47–52, 2006.
McEvoy, F. M., Schofield, D. I., Shaw, R. P., and Norris, S.: Tectonic and climatic considerations for deep geological disposal of radioactive waste: A UK perspective, Sci. Total Environ., 571, 507–521, 2016.
Milanković, M.: Kanon der Erdbestrahlung und seine Anwendung auf das Eiszeitenproblem, 655 pp., Königlich Serbische Akademie, Belgrad, 1941.
Moegle, E.: Supermaximalphasen des würmhochglazialen Rhein-Vorland-Gletschers, Jahresb. Mitt. Oberrh. Geol. Ver. NF, 76, 335–351, 1994.
Monegato, G., Ravazzi, C., Donegana, M., Pini, R., Calderoni, G., and Wick, L.: Evidence of a two-fold glacial advance during the last glacial maximum in the Tagliamento end moraine system (eastern Alps), Quaternary Res., 68, 284–302, 2007.
Murray, A. S. and Wintle, A. G.: Luminescence dating of quartz using an improved single-aliquot regenerative-dose protocol, Radiat. Meas., 32, 57–73, 2000.
Murray, A. S., Thomsen, K. J., Masuda, N., Buylaert, J. P., and Jain, M.: Identifying well-bleached quartz using the different bleaching rates of quartz and feldspar luminescence signals, Radiat. Meas., 47, 688–695, 2012.
Penck, A. and Brückner, E.: Die Alpen im Eiszeitalter, 1157 pp., Tauchnitz, Leipzig, 1901–1909.
Pietsch, T. J., Olley, J. M., and Nanson, G. C.: Fluvial transport as a natural luminescence sensitiser of quartz, Quat. Geochronol., 3, 365–376, 2008.
Prescott, J. R. and Hutton, J. T.: Cosmic ray contributions to dose rates for luminescence and ESR dating: Large depths and long-term time variations, Radiat. Meas., 23, 497–500, 1994.
Preusser, F.: Luminescence dating of fluvial sediments and overbank deposits from Gossau, Switzerland: fine grain dating, Quaternary Sci. Rev., 18, 217–222, 1999.
Preusser, F.: Towards a chronology of the Late Pleistocene in the northern Alpine Foreland, Boreas, 33, 195–210, 2004.
Preusser, F. and Degering, D.: Luminescence dating of the Niederweningen mammoth site, Switzerland, Quaternary Int., 164–165, 106–112, 2007.
Preusser, F. and Graf, H.: Erste Ergebnisse von Lumineszenzdatierungen eiszeitlicher Ablagerungen der Nordschweiz, Jahresb. Mitt. Oberrh. Geol. Ver. NF, 84, 419–438, 2002.
Preusser, F. and Kasper, H. U.: Comparison of dose rate determination using high-resolution gamma spectrometry and inductively coupled plasma-mass spectrometry, Ancient TL, 19, 19–23, 2001.
Preusser, F., Müller, B. U., and Schlüchter, C.: Luminescence dating of sediments from the Luthern Valley, central Switzerland, and implications for the chronology of the last glacial cycle, Quaternary Res., 55, 215–222, 2001.
Preusser, F., Geyh, M. A., and Schlüchter, C.: Timing of late pleistocene climate change in lowland Switzerland, Quaternary Sci. Rev., 22, 1435–1445, 2003.
Preusser, F., Ramseyer, K., and Schlüchter, C.: Characterisation of low luminescence intensity quartz from Westland, New Zealand, Radiat. Meas., 41, 871–877, 2006.
Preusser, F., Blei, A., Graf, H., and Schlüchter, C.: Luminescence dating of Würmian (Weichselian) proglacial sediments from Switzerland: methodological aspects and stratigraphical conclusions, Boreas, 36, 130–142, 2007.
Preusser, F., Reitner, J., and Schlüchter, C.: Distribution, geometry, age and origin of overdeepened valleys and basins in the Alps and their foreland, Swiss J. Geosci., 103, 407–426, 2010.
Preusser, F., Graf, H. R., Keller, O., Krayss, E., and Schlüchter, C.: Quaternary glaciation history of northern Switzerland, E&G Quaternary Sci. J., 60, 21, https://doi.org/10.3285/eg.60.2-3.06, 2011.
Ravazzi, C., Pini, R., Badino, F., De Amicis, M., Londeix, L., and Reimer, P. J.: The latest LGM culmination of the Garda Glacier (Italian Alps) and the onset of glacial termination. Age of glacial collapse and vegetation chronosequence, Quaternary Sci. Rev., 105, 26–47, 2014.
Reber, R., Akçar, N., Ivy-Ochs, S., Tikhomirov, D., Burkhalter, R., Zahno, C., Lüthold, A., Kubik, P. W., Vockenhuber, C., and Schlüchter, C.: Timing of retreat of the Reuss Glacier (Switzerland) at the end of the Last Glacial Maximum, Swiss J. Geosci., 107, 293–307, 2014.
Reimann, T., Tsukamoto, S., Naumann, M., and Frechen, M.: The potential of using K-rich feldspars for optical dating of young coastal sediments A test case from Darss-Zingst peninsula (southern Baltic Sea coast), Quat. Geochronol., 6, 207–222, 2011.
Reimer, P. J., Bard, E., Bayliss, A., Beck, J. W., Blackwell, P. G., Ramsey, C. B., Grootes, P. M., Guilderson, T. P., Haflidason, H., Hajdas, I., Hatté, C., Heaton, T. J., Hoffmann, D. L., Hogg, A. G., Hughen, K. A., Kaiser, K. F., Kromer, B., Manning, S. W., Niu, M., Reimer, R. W., Richards, D. A., Scott, E. M., Southon, J. R., Staff, R. A., Turney, C. S. M., and van der Plicht, J.: IntCal13 and Marine13 Radiocarbon Age Calibration Curves 0–50 000 Years cal BP, Radiocarbon, 55, 1869–1887, 2013.
Reuther, A. U., Fiebig, M., Ivy-Ochs, S., Kubik, P. W., Reitner, J. M., Jerz, H., and Heine, K.: Deglaciation of a large piedmont lobe glacier in comparison with a small mountain glacier – new insight from surface exposure dating. Two studies from SE Germany, E&G Quaternary Sci. J., 60, 18, https://doi.org/10.3285/eg.60.2-3.03, 2011.
Rowan, A. V., Roberts, H. M., Jones, M. A., Duller, G. A. T., Covey-Crump, S. J., and Brocklehurst, S. H.: Optically stimulated luminescence dating of glaciofluvial sediments on the Canterbury Plains, South Island, New Zealand, Quat. Geochronol., 8, 10–22, 2012.
Schlüchter, C.: The Quaternary Glaciations of Switzerland, with Special Reference to the Northern Alpine Foreland, Quaternary Sci. Rev., 5, 413–419, 1986.
Schlüchter, C. and Röthlisberger, C.: 100 000 Jahre Gletschergeschichte, in: Gletscher im ständigen Wandel, edited by: SANW, 47–63, vdf Hochschulverlag AG an der ETH Zürich, Zürich, 1995.
Schlüchter, C., Maisch, M., Suter, J., Fitze, P., Keller, W. A., Burga, C. A., and Wynistorf, E.: Das Schieferkohlen-Profil von Gossau (Kanton Zürich) und seine stratigraphische Stellung innerhalb der letzten Eiszeit, Vierteljahrsschr. Naturforsch. Ges. Zürich, 132, 135–174, 1987.
Schreiner, A.: Einführung in die Quartärgeologie, 257 pp., E. Schweizerbart, Stuttgart, 1992.
Seguinot, J., Ivy-Ochs, S., Jouvet, G., Huss, M., Funk, M., and Preusser, F.: Modelling last glacial cycle ice dynamics in the Alps, The Cryosphere, 12, 3265–3285, https://doi.org/10.5194/tc-12-3265-2018, 2018.
Sohbati, R., Murray, A. S., Buylaert, J. P., Ortuno, M., Cunha, P. P., and Masana, E.: Luminescence dating of Pleistocene alluvial sediments affected by the Alhama de Murcia fault (eastern Betics, Spain) – a comparison between OSL, IRSL and post-IR IRSL ages, Boreas, 41, 250–262, 2012.
Spencer, J. Q. and Owen, L. A.: Optically stimulated luminescence dating of Late Quaternary glaciogenic sediments in the upper Hunza valley: validating the timing of glaciation and assessing dating methods, Quaternary Sci. Rev., 23, 175–191, 2004.
Spötl, C., Reimer, P. J., Starnberger, R., and Reimer, R. W.: A new radiocarbon chronology of Baumkirchen, stratotype for the onset of the Upper Würmian in the Alps, J. Quat. Sci., 28, 552–558, 2013.
Starnberger, R., Rodnight, H., and Spötl, C.: Chronology of the Last Glacial Maximum in the Salzach Palaeoglacier Area (Eastern Alps), J. Quaternary Sci., 26, 502–510, 2011.
Starnberger, R., Drescher-Schneider, R., Reitner, J. M., Rodnight, H., Reimer, P. J., and Spötl, C.: Late Pleistocene climate change and landscape dynamics in the Eastern Alps: the inner-alpine Unterangerberg record (Austria), Quaternary Sci. Rev., 68, 17–42, 2013.
Stokes, C. R., Tarasov, L., Blomdin, R., Cronin, T. M., Fisher, T. G., Gyllencreutz, R., Hättestrand, C., Heyman, J., Hindmarsh, R., Hughes, A., Jakobsson, M., Kirchner, N., Livingstone, S. J., Margold, M., Murton, J., Noormets, R., Peltier, R. W., Peteet, D. M., Piper, D., Preusser, F., Renssen, H., Roberts, D. H., Roche, D., Saint-Ange, F., Stroeven, A. P., and Teller, J. T.: On the reconstruction of palaeo-ice sheets: Recent advances and future challenges, Quaternary Sci. Rev., 125, 15–49, 2015.
Thomsen, K. J., Murray, A. S., Jain, M., and Botter-Jensen, L.: Laboratory fading rates of various luminescence signals from feldspar-rich sediment extracts, Radiat. Meas., 43, 1474–1486, 2008.
Thomsen, K. J., Murray, A. S., Buylaert, J. P., Jain, M., Hansen, J. H., and Aubry, T.: Testing single-grain quartz OSL methods using sediment samples with independent age control from the Bordes-Fitte rockshelter (Roches d'Abilly site, Central France), Quat. Geochronol., 31, 77–96, 2016.
Trauerstein, M., Lowick, S., Preusser, F., Rufer, D., and Schlunegger, F.: Exploring fading in single grain feldspar IRSL measurements, Quat. Geochronol., 10, 327–333, 2012.
Veit, H., Trauerstein, M., Preusser, F., Messmer, T., Gnägi, C., Zech, R., and Wüthrich, L.: Late Glacial/Early Holocene slope deposits on the Swiss Plateau: Genesis and palaeo-environment, Catena, 158, 102–112, 2017.
Wallinga, J.: On the detection of OSL age overestimation using single-aliquot techniques, Geochronometria, 21, 17–26, 2002.
Wallinga, J., Bos, A. J. J., Dorenbos, P., Murray, A. S., and Schokker, J.: A test for anomalous fading correction in IRSL dating, Quat. Geochronol., 2, 216–221, 2007.
Weinhold, H.: Beiträge zur Kenntnis des Quartärs im württembergischen Allgäu zwischen östlichem Bodensee und Altdorfer Wald, PhD thesis, Universität Tübingen, Tübingen, 1973.
Welten, M.: Verdrängung und Vernichtung der anspruchsvollen Gehölze am Beginn der letzten Eiszeit und die Korrelation der Frühwürm-Interstadiale in Mittel- und Nordeuropa, Eiszeit und. Gegenw., 31, 187–202, 1981.
Werner, J.: Über die Zeit zwischen Riss- und Würmglazial, insbesondere im deutschen Rheingletschergebiet, Heidelberger geograph. Arb., 40, 121–130, 1974.
Yokoyama, Y., Lambeck, K., De Deckker, P., Johnston, P., and Fifield, L. K.: Timing of the Last Glacial Maximum from observed sea-level minima, Nature, 406, 713–716, 2000.